Chevron 2006 Annual Report Download - page 98
Download and view the complete annual report
Please find page 98 of the 2006 Chevron annual report below. You can navigate through the pages in the report by either clicking on the pages listed below, or by using the keyword search tool below to find specific information within the annual report.-
 1
1 -
2
-
3
-
4
-
5
-
6
-
7
-
8
-
9
-
10
-
11
-
12
-
13
-
14
-
15
-
16
-
17
-
18
-
19
-
20
-
21
-
22
-
23
-
24
-
25
-
26
-
27
-
28
-
29
-
30
-
31
-
32
-
33
-
34
-
35
-
36
-
37
-
38
-
39
-
40
-
41
-
42
-
43
-
44
-
45
-
46
-
47
-
48
-
49
-
50
-
51
-
52
-
53
-
54
-
55
-
56
-
57
-
58
-
59
-
60
-
61
-
62
-
63
-
64
-
65
-
66
-
67
-
68
-
69
-
70
-
71
-
72
-
73
-
74
-
75
-
76
-
77
-
78
-
79
-
80
-
81
-
82
-
83
-
84
-
85
-
86
-
87
-
 88
88 -
 89
89 -
 90
90 -
 91
91 -
 92
92 -
 93
93 -
 94
94 -
 95
95 -
 96
96 -
 97
97 -
 98
98 -
 99
99 -
 100
100 -
 101
101 -
 102
102 -
 103
103 -
 104
104 -
 105
105 -
 106
106 -
 107
107 -
 108
108
 |
 |

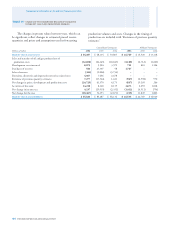
96 CHEVRON CORPORATION 2006 ANNUAL REPORT
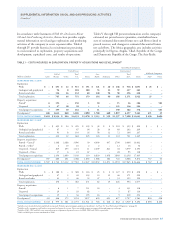
NET PROVED RESERVES OF NATURAL GAS
Consolidated Companies
United States
International
Gulf of Total A sia- Tot a l Affi liated Companies
Billions of cubic feet Calif. Mexico Other U.S. Africa Pacifi c Indonesia Other Int’l. Total TCO Other
RESERVES AT JAN. 1, 2004 323 1,841 3,189 5,353 2,642 5,373 520 3,665 12,200 17,553 2,526 112
Changes attributable to:
Revisions 27 (391) (316) (680) 346 236 21 325 928 248 963 23
Improved recovery 2 – 1 3 7 – 13 – 20 23 – –
Extensions and
discoveries 1 54 89 144 16 39 2 13 70 214 – –
Purchases1 – 5 – 5 – 4 – – 4 9 – –
Sales2 – (147) (289) (436) – – – (111) (111) (547) – –
Production (39) (298) (348) (685) (32) (247) (54) (354) (687) (1,372) (76) (1)
RESERVES AT DEC. 31, 20043 314 1,064 2,326 3,704 2,979 5,405 502 3,538 12,424 16,128 3,413 134
Changes attributable to:
Revisions 21 (15) (15) (9) 211 (428) (31) 243 (5) (14) (547) 49
Improved recovery 8 – – 8 13 – – 31 44 52 – –
Extensions and
discoveries – 68 99 167 25 118 5 55 203 370 – –
Purchases1 – 269 899 1,168 5 3,962 247 274 4,488 5,656 – –
Sales2 – – (6) (6) – – – (248) (248) (254) – –
Production (39) (215) (350) (604) (42) (434) (77) (315) (868) (1,472) (79) (2)
RESERVES AT DEC. 31, 20053 304 1,171 2,953 4,428 3,191 8,623 646 3,578 16,038 20,466 2,787 181
Changes attributable to:
Revisions 32 40 (102) (30) 34 400 38 39 511 481 26 –
Improved recovery 5 – – 5 3 – – 5 8 13 – –
Extensions and
discoveries – 111 157 268 11 510 – 10 531 799 – –
Purchases1 6 13 – 19 – 16 – – 16 35 – 54
Sales2 – – (1) (1) – – – (148) (148) (149) – –
Production (37) (241) (383) (661) (33) (629) (110) (302) (1,074) (1,735) (70) (4)
RESERVES AT DEC. 31, 20063,4 310 1,094 2,624 4,028 3,206 8,920 574 3,182 15,882 19,910 2,743 231
DEVELOPED RESERVES5
At Jan. 1, 2004 265 1,572 2,964 4,801 954 3,627 223 3,043 7,847 12,648 1,789 52
At Dec. 31, 2004 252 937 2,191 3,380 1,108 3,701 271 2,273 7,353 10,733 2,584 63
At Dec. 31, 2005 251 977 2,794 4,022 1,346 4,819 449 2,453 9,067 13,089 2,314 85
At Dec. 31, 2006 250 873 2,434 3,557 1,306 4,751 377 1,912 8,346 11,903 1,412 144
1 Includes reserves acquired through property exchanges.
2 Includes reserves disposed of through property exchanges.
3 Included are year-end reserve quantities related to production-sharing contracts (PSC) (refer to page 24 for the defi nition of a PSC). PSC-related reserve quantities are 47 percent, 44 percent
and 33 percent for consolidated companies for 2006, 2005 and 2004, respectively, and 100 percent for TCO for each year.
4 Net reserve changes (excluding production) in 2006 consist of 549 billion cubic feet of developed reserves and 630 billion cubic feet of undeveloped reserves for consolidated companies
and (769) billion cubic feet of developed reserves and 849 billion cubic feet of undeveloped reserves for affi liated companies.
5 During 2005, the percentages of undeveloped reserves at December 31, 2004, transferred to developed reserves were 5 percent and 2 percent for consolidated companies and affi liated
companies, respectively.
Noteworthy amounts in the categories of proved-reserve
changes for 2004 through 2006 in the table above are dis-
cussed below:
Revisions In 2004, revisions increased reserves for con-
solidated companies by a net 248 billion cubic feet (BCF),
composed of increases of 928 BCF internationally and
decreases of 680 BCF in the United States. Internationally,
about half of the 346 BCF increase in Africa related to prop-
erties in Nigeria, for which changes were associated with well
performance reviews, development drilling and lease fuel cal-
culations. The 236 BCF addition in the Asia-Pacifi c region
was related primarily to reservoir analysis for a single fi eld.
Most of the 325 BCF in the “Other” international area was
related to a new gas sales contract in Trinidad and Tobago.
In the United States, the net 391 BCF downward revision in
the Gulf of Mexico was related to well-performance reviews
and technical analyses in several fi elds. Most of the net 316
BCF negative revision in the “Other” U.S. area related to two
coal bed methane fi elds in the Mid-Continent region and
their associated wells’ performance. The 963 BCF increase
for TCO was connected with updated analyses of reservoir
performance and processing plant yields.
In 2005, reserves were revised downward by 14 BCF for
consolidated companies and 498 BCF for equity affi liates.
For consolidated companies, negative revisions were 428 BCF
in the Asia-Pacifi c region. Most of the decrease was attribut-
TABLE V – RESERVE QUANTITY INFORMATION – Continued
Supplemental Information on Oil and Gas Producing Activities