Chevron 2006 Annual Report Download - page 95
Download and view the complete annual report
Please find page 95 of the 2006 Chevron annual report below. You can navigate through the pages in the report by either clicking on the pages listed below, or by using the keyword search tool below to find specific information within the annual report.-
 1
1 -
2
-
3
-
4
-
5
-
6
-
7
-
8
-
9
-
10
-
11
-
12
-
13
-
14
-
15
-
16
-
17
-
18
-
19
-
20
-
21
-
22
-
23
-
24
-
25
-
26
-
27
-
28
-
29
-
30
-
31
-
32
-
33
-
34
-
35
-
36
-
37
-
38
-
39
-
40
-
41
-
42
-
43
-
44
-
45
-
46
-
47
-
48
-
49
-
50
-
51
-
52
-
53
-
54
-
55
-
56
-
57
-
58
-
59
-
60
-
61
-
62
-
63
-
64
-
65
-
66
-
67
-
68
-
69
-
70
-
71
-
72
-
73
-
74
-
75
-
76
-
77
-
78
-
79
-
80
-
81
-
82
-
83
-
84
-
 85
85 -
 86
86 -
 87
87 -
 88
88 -
 89
89 -
 90
90 -
 91
91 -
 92
92 -
 93
93 -
 94
94 -
 95
95 -
 96
96 -
 97
97 -
 98
98 -
 99
99 -
 100
100 -
 101
101 -
 102
102 -
 103
103 -
 104
104 -
 105
105 -
106
-
107
-
108
 |
 |

CHEVRON CORPORATION 2006 ANNUAL REPORT 93
During the year, the RAC is represented in meetings
with each of the company’s upstream business units to review
and discuss reserve changes recommended by the various
asset teams. Major changes are also reviewed with the com-
pany’s Strategy and Planning Committee and the Executive
Committee, whose members include the Chief Executive
Offi cer and the Chief Financial Offi cer. The company’s annual
reserve activity is also reviewed with the Board of Directors.
If major changes to reserves were to occur between the annual
reviews, those matters would also be discussed with the Board.
RAC subteams also conduct in-depth reviews during
the year of many of the fi elds that have the largest proved
reserves quantities. These reviews include an examination of
the proved-reserve records and documentation of their align-
ment with the Corporate Reserves Manual.
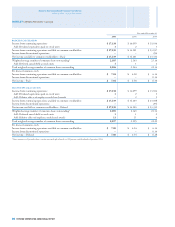
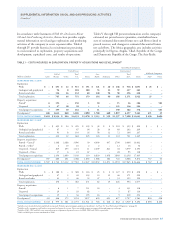
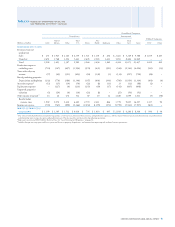
Reserve Quantities At December 31, 2006, oil-equivalent
reserves for the company’s consolidated operations were 8.6
billion barrels. (Refer to page 24 for the defi nition of oil-equiv-
alent reserves.) Approximately 28 percent of the total reserves
were in the United States. For the company’s interests in equity
affi liates, oil-equivalent reserves were 3 billion barrels, 80 per-
cent of which were associated with the company’s 50 percent
ownership in TCO. During the year, the company’s Boscan
and LL-652 contracts in Venezuela were converted to
Empresas Mixtas (i.e., joint stock contractual structures). The
company had not previously recorded any reserves for its
Boscan operations, but did so this year as a result of the con-
version. The conversion of LL-652 reserves was treated as the
sale of consolidated company reserves and the acquisition of
equity affi liate reserves.
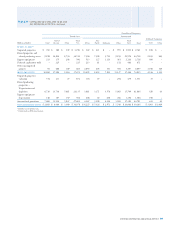
Aside from the TCO operations, no single property
accounted for more than 5 percent of company’s total oil-
equivalent proved reserves. Fewer than 20 other individual
properties in the company’s portfolio of assets each contained
between 1 percent and 5 percent of the company’s oil-equiva-
lent proved reserves, which in the aggregate accounted for
about 36 percent of the company’s proved reserves total.
These properties were geographically dispersed, located in the
United States, South America, West Africa, the Middle East
and the Asia-Pacifi c region.
In the United States, total oil-equivalent reserves at
year-end 2006 were 2.4 billion barrels. Of this amount, 40
percent, 21 percent and 39 percent were located in California,
the Gulf of Mexico and other U.S. areas, respectively.
In California, liquids reserves represented 95 percent of
the total, with most classifi ed as heavy oil. Because of heavy
oil’s high viscosity and the need to employ enhanced recovery
methods, the producing operations are capital intensive in
nature. Most of the company’s heavy-oil fi elds in California
employ a continuous steamfl ooding process.
In the Gulf of Mexico region, liquids represented approx-
imately 64 percent of total oil-equivalent reserves. Production
operations are mostly offshore and, as a result, are also capital
intensive. Costs include investments in wells, production plat-
forms and other facilities, such as gathering lines and storage
facilities.
In other U.S. areas, the reserves were split about equally
between liquids and natural gas. For production of crude oil,
some fi elds utilize enhanced recovery methods, including
waterfl ood and CO2 injection.
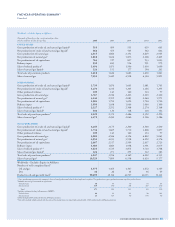
The pattern of net reserve changes shown in the follow-
ing tables, for the three years ending December 31, 2006, is
not necessarily indicative of future trends. Apart from acquisi-
tions, the company’s ability to add proved reserves is affected
by, among other things, events and circumstances that are
outside the company’s control, such as delays in government
permitting, partner approvals of development plans, declines
in oil and gas prices, OPEC constraints, geopolitical uncer-
tainties, and civil unrest.
The company’s estimated net proved underground oil
and natural gas reserves and changes thereto for the years
2004, 2005 and 2006 are shown in the tables on pages 94
and 96.
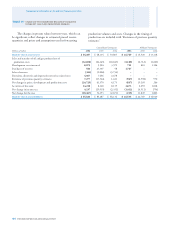
TABLE V – RESERVE QUANTITY INFORMATION – Continued