Chevron 2006 Annual Report Download - page 65
Download and view the complete annual report
Please find page 65 of the 2006 Chevron annual report below. You can navigate through the pages in the report by either clicking on the pages listed below, or by using the keyword search tool below to find specific information within the annual report.-
 1
1 -
2
-
3
-
4
-
5
-
6
-
7
-
8
-
9
-
10
-
11
-
12
-
13
-
14
-
15
-
16
-
17
-
18
-
19
-
20
-
21
-
22
-
23
-
24
-
25
-
26
-
27
-
28
-
29
-
30
-
31
-
32
-
33
-
34
-
35
-
36
-
37
-
38
-
39
-
40
-
41
-
42
-
43
-
44
-
45
-
46
-
47
-
48
-
49
-
50
-
51
-
52
-
53
-
54
-
 55
55 -
 56
56 -
 57
57 -
 58
58 -
 59
59 -
 60
60 -
 61
61 -
 62
62 -
 63
63 -
 64
64 -
 65
65 -
 66
66 -
 67
67 -
 68
68 -
 69
69 -
 70
70 -
 71
71 -
 72
72 -
 73
73 -
 74
74 -
 75
75 -
76
-
77
-
78
-
79
-
80
-
81
-
82
-
83
-
84
-
85
-
86
-
87
-
88
-
89
-
90
-
91
-
92
-
93
-
94
-
95
-
96
-
97
-
98
-
99
-
100
-
101
-
102
-
103
-
104
-
105
-
106
-
107
-
108
 |
 |

CHEVRON CORPORATION 2006 ANNUAL REPORT 63CHEVRON CORPORATION 2006 ANNUAL REPORT 63
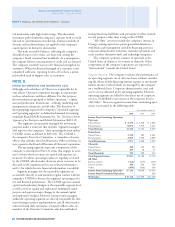
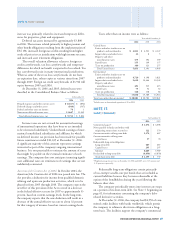
NOTE 8. OPERATING SEGMENTS AND GEOGRAPHIC DATA – Continued
Segment Assets Segment assets do not include intercompany
investments or intercompany receivables. Segment assets at
year-end 2006 and 2005 are as follows:
At December 31
2006 2005
Upstream
United States $ 20,727 $ 19,006
International 51,844 46,501
Goodwill 4,623 4,636
Total Upstream 77,194 70,143
Downstream
United States 13,482 12,273
International 22,892 22,294
Total Downstream 36,374 34,567
Chemicals
United States 2,568 2,452
International 832 727
Total Chemicals 3,400 3,179
Total Segment Assets 116,968 107,889
All Other*
United States 8,481 9,234
International 7,179 8,710
Total All Other 15,660 17,944
Total Assets – United States 45,258 42,965
Total Assets – International 82,747 78,232
Goodwill 4,623 4,636
Total Assets $ 132,628 $ 125,833
* “All Other” assets consist primarily of worldwide cash, cash equivalents and marketable
securities, real estate, information systems, the company’s investment in Dynegy, mining
operations, power generation businesses, technology companies, and assets of the corpo-
rate administrative functions.
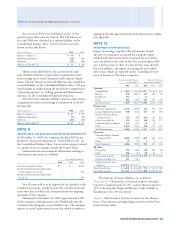
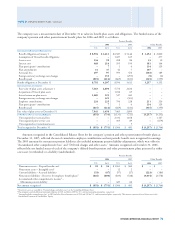
Segment Sales and Other Operating Revenues Operating seg-
ment sales and other operating revenues, including internal
transfers, for the years 2006, 2005 and 2004 are presented
in the following table. Products are transferred between
operating segments at internal product values that approxi-
mate market prices.
Revenues for the upstream segment are derived primarily
from the production and sale of crude oil and natural gas,
as well as the sale of third-party production of natural gas.
Revenues for the downstream segment are derived from the
refi ning and marketing of petroleum products, such as gaso-
line, jet fuel, gas oils, kerosene, lubricants, residual fuel oils
and other products derived from crude oil. This segment
also generates revenues from the transportation and trading
of crude oil and refi ned products. Revenues for the chemicals
segment are derived primarily from the manufacture and sale
of additives for lubricants and fuel. “All Other” activities
include revenues from mining operations of coal and other
minerals, power generation businesses, insurance operations,
real estate activities, and technology companies.
Other than the United States, no single country accounted
for 10 percent or more of the company’s total sales and other
operating revenues in 2006.
Year ended December 31
2006 2005 2004
Upstream
United States $ 18,061 $ 16,044 $ 8,242
Intersegment 10,069 8,651 8,121
Tot al United St ates 28,130 24,695 16,363
International 14,560 10,190 7,246
Intersegment 17,139 13,652 10,184
Total International 31,699 23,842 17,430
Total Upstream 59,829 48,537 33,793
Downstream
United States 69,367 73,721 57,723
Excise and other similar taxes 4,829 4,521 4,147
Intersegment 533 535 179
Tot al United St ates 74,729 78,777 62,049
International 91,325 83,223 67,944
Excise and other similar taxes 4,657 4,184 3,810
Intersegment 37 14 87
Total International 96,019 87,421 71,841
Total Downstream 170,748 166,198 133,890
Chemicals
United States 372 343 347
Excise and other similar taxes 2 – –
Intersegment 243 241 188
Tot al United St ates 617 584 535
International 959 760 747
Excise and other similar taxes 63 14 11
Intersegment 160 131 107
Total International 1,182 905 865
Total Chemicals 1,799 1,489 1,400
All Other
United States 653 597 551
Intersegment 584 514 431
Tot al United St ates 1,237 1,111 982
International 44 44 97
Intersegment 23 26 16
Total International 67 70 113
Total All Other 1,304 1,181 1,095
Segment Sales and Other
Operating Revenues
United States 104,713 105,167 79,929
International 128,967 112,238 90,249
Total Segment Sales and Other
Operating Revenues 233,680 217,405 170,178
Elimination of intersegment sales (28,788) (23,764) (19,313)
Total Sales and Other
Operating Revenues* $ 204,892 $ 193,641 $ 150,865
* Includes buy/sell contracts of $6,725 in 2006, $23,822 in 2005 and $18,650 in 2004.
Substantially all of the amounts in each period relates to the downstream segment. Refer to
Note 14, on page 67, for a discussion of the company’s accounting for buy/sell contracts.