Chevron 2006 Annual Report Download - page 88
Download and view the complete annual report
Please find page 88 of the 2006 Chevron annual report below. You can navigate through the pages in the report by either clicking on the pages listed below, or by using the keyword search tool below to find specific information within the annual report.-
 1
1 -
2
-
3
-
4
-
5
-
6
-
7
-
8
-
9
-
10
-
11
-
12
-
13
-
14
-
15
-
16
-
17
-
18
-
19
-
20
-
21
-
22
-
23
-
24
-
25
-
26
-
27
-
28
-
29
-
30
-
31
-
32
-
33
-
34
-
35
-
36
-
37
-
38
-
39
-
40
-
41
-
42
-
43
-
44
-
45
-
46
-
47
-
48
-
49
-
50
-
51
-
52
-
53
-
54
-
55
-
56
-
57
-
58
-
59
-
60
-
61
-
62
-
63
-
64
-
65
-
66
-
67
-
68
-
69
-
70
-
71
-
72
-
73
-
74
-
75
-
76
-
77
-
 78
78 -
 79
79 -
 80
80 -
 81
81 -
 82
82 -
 83
83 -
 84
84 -
 85
85 -
 86
86 -
 87
87 -
 88
88 -
 89
89 -
 90
90 -
 91
91 -
 92
92 -
 93
93 -
 94
94 -
 95
95 -
 96
96 -
 97
97 -
 98
98 -
99
-
100
-
101
-
102
-
103
-
104
-
105
-
106
-
107
-
108
 |
 |

86 CHEVRON CORPORATION 2006 ANNUAL REPORT86 CHEVRON CORPORATION 2006 ANNUAL REPORT
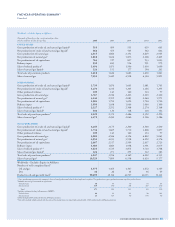
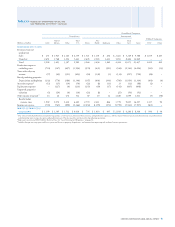
FIVE-YEAR FINANCIAL SUMMARY
Unaudited
Millions of dollars, except per-share amounts 2006 2005 2004 2003 2002
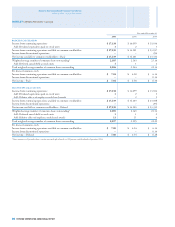
COMBINED STATEMENT OF INCOME DATA
REVENUES AND OTHER INCOME
Total sales and other operating revenues $ 204,892 $ 193,641 $ 150,865 $ 119,575 $ 98,340
Income from equity affi liates and other income 5,226 4,559 4,435 1,702 197
TOTAL REVENUES AND OTHER INCOME 210,118 198,200 155,300 121,277 98,537
TOTAL COSTS AND OTHER DEDUCTIONS 178,142 173,003 134,749 108,601 94,437
INCOME FROM CONTINUING OPERATIONS BEFORE INCOME TAXES 31,976 25,197 20,551 12,676 4,100
INCOME TAX EXPENSE 14,838 11,098 7,517 5,294 2,998
INCOME FROM CONTINUING OPERATIONS 17,138 14,099 13,034 7,382 1,102
INCOME FROM DISCONTINUED OPERATIONS – – 294 44 30
INCOME BEFORE EXTRAORDINARY ITEM AND
CUMULATIVE EFFECT OF CHANGES IN ACCOUNTING PRINCIPLES 17,138 14,099 13,328 7,426 1,132
Cumulative effect of changes in accounting principles – – – (196) –
NET INCOME $ 17,138 $ 14,099 $ 13,328 $ 7,230 $ 1,132
PER SHARE OF COMMON STOCK1
INCOME FROM CONTINUING OPERATIONS2
– Basic $ 7.84 $ 6.58 $ 6.16 $ 3.55 $ 0.52
– Diluted $ 7.80 $ 6.54 $ 6.14 $ 3.55 $ 0.52
INCOME FROM DISCONTINUED OPERATIONS
– Basic $ – $ – $ 0.14 $ 0.02 $ 0.01
– Diluted $ – $ – $ 0.14 $ 0.02 $ 0.01
CUMULATIVE EFFECT OF CHANGES IN ACCOUNTING PRINCIPLES
– Basic $ – $ – $ – $ (0.09) $ –
– Diluted $ – $ – $ – $ (0.09) $ –
NET INCOME2
– Basic $ 7.84 $ 6.58 $ 6.30 $ 3.48 $ 0.53
– Diluted $ 7.80 $ 6.54 $ 6.28 $ 3.48 $ 0.53
CASH DIVIDENDS PER SHARE $ 2.01 $ 1.75 $ 1.53 $ 1.43 $ 1.40
COMBINED BALANCE SHEET DATA (AT DECEMBER 31)
Current assets $ 36,304 $ 34,336 $ 28,503 $ 19,426 $ 17,776
Noncurrent assets 96,324 91,497 64,705 62,044 59,583
TOTAL ASSETS 132,628 125,833 93,208 81,470 77,359
Short-term debt 2,159 739 816 1,703 5,358
Other current liabilities 26,250 24,272 17,979 14,408 14,518
Long-term debt and capital lease obligations 7,679 12,131 10,456 10,894 10,911
Other noncurrent liabilities 27,605 26,015 18,727 18,170 14,968
TOTAL LIABILITIES 63,693 63,157 47,978 45,175 45,755
STOCKHOLDERS’ EQUITY $ 68,935 $ 62,676 $ 45,230 $ 36,295 $ 31,604
1 Per-share amounts in all periods refl ect a two-for-one stock split effected as a 100 percent stock dividend in September 2004.
2 The amount in 2003 includes a benefi t of $0.08 for the company’s share of a capital stock transaction of its Dynegy affi liate, which, under the applicable accounting rules, was recorded directly
to retained earnings and not included in net income for the period.