Chevron 2006 Annual Report Download - page 53
Download and view the complete annual report
Please find page 53 of the 2006 Chevron annual report below. You can navigate through the pages in the report by either clicking on the pages listed below, or by using the keyword search tool below to find specific information within the annual report.-
 1
1 -
2
-
3
-
4
-
5
-
6
-
7
-
8
-
9
-
10
-
11
-
12
-
13
-
14
-
15
-
16
-
17
-
18
-
19
-
20
-
21
-
22
-
23
-
24
-
25
-
26
-
27
-
28
-
29
-
30
-
31
-
32
-
33
-
34
-
35
-
36
-
37
-
38
-
39
-
40
-
41
-
42
-
 43
43 -
 44
44 -
 45
45 -
 46
46 -
 47
47 -
 48
48 -
 49
49 -
 50
50 -
 51
51 -
 52
52 -
 53
53 -
 54
54 -
 55
55 -
 56
56 -
 57
57 -
 58
58 -
 59
59 -
 60
60 -
 61
61 -
 62
62 -
 63
63 -
64
-
65
-
66
-
67
-
68
-
69
-
70
-
71
-
72
-
73
-
74
-
75
-
76
-
77
-
78
-
79
-
80
-
81
-
82
-
83
-
84
-
85
-
86
-
87
-
88
-
89
-
90
-
91
-
92
-
93
-
94
-
95
-
96
-
97
-
98
-
99
-
100
-
101
-
102
-
103
-
104
-
105
-
106
-
107
-
108
 |
 |

CHEVRON CORPORATION 2006 ANNUAL REPORT 51CHEVRON CORPORATION 2006 ANNUAL REPORT 51
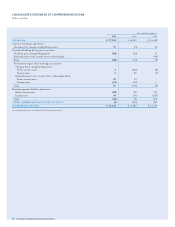
Year ended December 31
2006 2005 2004
REVENUES AND OTHER INCOME
Sales and other operating revenues1,2 $ 204,892 $ 193,641 $ 150,865
Income from equity affiliates 4,255 3,731 2,582
Other income 971 828 1,853
TOTAL REVENUES AND OTHER INCOME 210,118 198,200 155,300
COSTS AND OTHER DEDUCTIONS
Purchased crude oil and products2 128,151 127,968 94,419
Operating expenses 14,624 12,191 9,832
Selling, general and administrative expenses 5,093 4,828 4,557
Exploration expenses 1,364 743 697
Depreciation, depletion and amortization 7,506 5,913 4,935
Taxes other than on income1 20,883 20,782 19,818
Interest and debt expense 451 482 406
Minority interests 70 96 85
TOTAL COSTS AND OTHER DEDUCTIONS 178,142 173,003 134,749
INCOME FROM CONTINUING OPERATIONS BEFORE INCOME TAX EXPENSE 31,976 25,197 20,551
INCOME TAX EXPENSE 14,838 11,098 7,517
INCOME FROM CONTINUING OPERATIONS 17,138 14,099 13,034
INCOME FROM DISCONTINUED OPERATIONS – – 294
NET INCOME $ 17,138 $ 14,099 $ 13,328
PER-SHARE OF COMMON STOCK3
INCOME FROM CONTINUING OPERATIONS
– BASIC $ 7.84 $ 6.58 $ 6.16
– DILUTED $ 7.80 $ 6.54 $ 6.14
INCOME FROM DISCONTINUED OPERATIONS
– BASIC $ – $ – $ 0.14
– DILUTED $ – $ – $ 0.14
NET INCOME
– BASIC $ 7.84 $ 6.58 $ 6.30
– DILUTED $ 7.80 $ 6.54 $ 6.28
1
Includes excise, value-added and other similar taxes: $ 9,551 $ 8,719 $ 7,968
2 Includes amounts in revenues for buy/sell contracts; associated costs are in “Purchased crude oil and products.”
Refer also to Note 14, on page 67. $ 6,725 $ 23,822 $ 18,650
3
All periods refl ect a two-for-one stock split effected as a 100 percent stock dividend in September 2004.
See accompanying Notes to the Consolidated Financial Statements.
CONSOLIDATED STATEMENT OF INCOME
Millions of dollars, except per-share amounts