Chevron 2006 Annual Report Download - page 35
Download and view the complete annual report
Please find page 35 of the 2006 Chevron annual report below. You can navigate through the pages in the report by either clicking on the pages listed below, or by using the keyword search tool below to find specific information within the annual report.-
 1
1 -
2
-
3
-
4
-
5
-
6
-
7
-
8
-
9
-
10
-
11
-
12
-
13
-
14
-
15
-
16
-
17
-
18
-
19
-
20
-
21
-
22
-
23
-
24
-
 25
25 -
 26
26 -
 27
27 -
 28
28 -
 29
29 -
 30
30 -
 31
31 -
 32
32 -
 33
33 -
 34
34 -
 35
35 -
 36
36 -
 37
37 -
 38
38 -
 39
39 -
 40
40 -
 41
41 -
 42
42 -
 43
43 -
 44
44 -
 45
45 -
46
-
47
-
48
-
49
-
50
-
51
-
52
-
53
-
54
-
55
-
56
-
57
-
58
-
59
-
60
-
61
-
62
-
63
-
64
-
65
-
66
-
67
-
68
-
69
-
70
-
71
-
72
-
73
-
74
-
75
-
76
-
77
-
78
-
79
-
80
-
81
-
82
-
83
-
84
-
85
-
86
-
87
-
88
-
89
-
90
-
91
-
92
-
93
-
94
-
95
-
96
-
97
-
98
-
99
-
100
-
101
-
102
-
103
-
104
-
105
-
106
-
107
-
108
 |
 |

CHEVRON CORPORATION 2006 ANNUAL REPORT 33
and 2004, respectively, but reduced income by $24 million
in 2005.
Refi ned-product sales volumes were 2.1 million barrels
per day in 2006, about 6 percent lower than 2005. Exclud-
ing the accounting change for buy/sell contracts, sales were
down 1 percent between 2005 and 2006. Refi ned-product
sales volume of 2.3 million barrels per day in 2005 were
about 4 percent lower than in 2004, primarily the result of
lower gasoline trading activity and lower fuel oil sales. Refer
to the “Selected Operating Data” table, on page 35, for the
three-year comparative refi ned-product sales volumes in the
international areas.
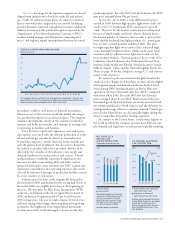
Chemicals
Millions of dollars 2006 2005 2004
Income* $ 539 $ 298 $ 314
*Includes Foreign Currency Effects: $ (8) $ – $ (3)
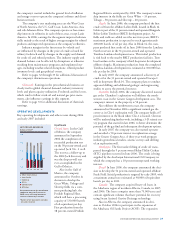
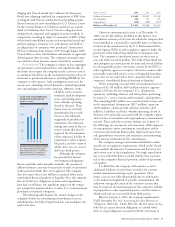
The chemicals segment
includes the company’s
Oronite subsidiary and the
50 percent-owned Chevron
Phillips Chemical Company
LLC (CPChem). In 2006,
earnings of $539 million
increased about $200 million
from both 2005 and 2004.
Margins in 2006 for com-
modity chemicals at CPChem
and for fuel and lubricant
additives at Oronite were
higher than in 2005 and
2004. The earnings decline
from 2004 to 2005 was
mainly attributable to plant
outages and expenses in the
Gulf of Mexico region due to
hurricanes, which affected
both Oronite and CPChem.
All Other
Millions of dollars 2006 2005 2004
Net Charges* $ (516) $ (689) $ (20)
*Includes Foreign Currency Effects: $ 62 $ (51) $ 44
All Other consists of the company’s interest in Dynegy
Inc., mining operations, power generation businesses,
worldwide cash management and debt fi nancing activities,
corporate administrative functions, insurance operations,
real estate activities, and technology companies.
Net charges of $516 million in 2006 decreased $173
million from $689 million in 2005. Excluding the effects of
foreign currency, net charges declined $60 million between
periods. Interest income was higher in 2006, and interest
expense was lower.
Between 2004 and 2005, net charges increased $669
million. Excluding the effects of foreign exchange, net
charges increased $574 million. Approximately $400 million
of the increase was related to larger benefi ts in 2004 from
corporate-level tax adjustments. Higher charges in 2005 also
were associated with environmental remediation of properties
that had been sold or idled and Unocal corporate-level activi-
ties. Interest expense was higher in 2005 due to an increase in
interest rates and the debt assumed with the Unocal acquisition.
CONSOLIDATED STATEMENT OF INCOME
Comparative amounts for certain income statement catego-
ries are shown below:
Millions of dollars 2006 2005 2004
Sales and other operating revenues $ 204,892 $ 193,641 $ 150,865
Sales and other operating revenues in 2006 increased
over 2005 due primarily to higher prices for refi ned prod-
ucts. The increase in 2005 from 2004 was a result of the
same factor plus the effect of higher average prices for crude
oil and natural gas. The higher revenues in 2006 were net
of an impact from the change in the accounting for buy/sell
contracts, as described in Note 14 on page 67.
Millions of dollars 2006 2005 2004
Income from equity affi liates $ 4,255 $ 3,731 $ 2,582
Increased income from equity affi liates in 2006 was
mainly due to improved results for Tengizchevroil (TCO)
and CPChem. The improvement in 2005 from 2004 was
primarily due to improved results for TCO and Hamaca
(Venezuela). Refer to Note 12, beginning on page 65, for a
discussion of Chevron’s investment in affi liated companies.
Millions of dollars 2006 2005 2004
Other income $ 971 $ 828 $ 1,853
Other income of nearly $1.9 billion in 2004 included
approximately $1.3 billion of gains from upstream property
sales. Interest income contributed $600 million, $400 million
and $200 million in 2006, 2005 and 2004, respectively. Aver-
age interest rates and balances of cash and marketable securities
increased each year. Foreign currency losses were $260 million
in 2006 and $60 million in both 2005 and 2004.
Millions of dollars 2006 2005 2004
Purchased crude oil and products $ 128,151 $ 127,968 $ 94,419
Crude oil and product purchases in 2006 increased
from 2005 on higher prices for crude oil and refi ned prod-
ucts and the inclusion of Unocal-related amounts for a full
year in 2006. The increase was mitigated by the effect of
the accounting change in April 2006 for buy/sell contracts.
Purchase costs increased 35 percent in 2005 from the prior
year as a result of higher prices for crude oil, natural gas and
refi ned products, as well as to the inclusion of Unocal-related
amounts for fi ve months.
'
-''
)''
(''
*''
+''
,''
NFIC;N@;<:?<D@:8CJ
<8IE@E>J!
D`cc`fejf][fccXij
:_\d`ZXcj\Xie`e^j`eZi\Xj\[XYflk
/(g\iZ\ek]ifd)'',[l\kf_`^_\i
dXi^`ejXe[k_\XYj\eZ\f]k_\
\]]\Zkjf])'',jkfidj`ek_\L%J%
>lc]f]D\o`Zf%
!@eZcl[\j\hl`kp`eX]Ôc`Xk\j
'*') '+ ', '-
,*0