Chevron 2006 Annual Report Download - page 30
Download and view the complete annual report
Please find page 30 of the 2006 Chevron annual report below. You can navigate through the pages in the report by either clicking on the pages listed below, or by using the keyword search tool below to find specific information within the annual report.-
 1
1 -
2
-
3
-
4
-
5
-
6
-
7
-
8
-
9
-
10
-
11
-
12
-
13
-
14
-
15
-
16
-
17
-
18
-
19
-
 20
20 -
 21
21 -
 22
22 -
 23
23 -
 24
24 -
 25
25 -
 26
26 -
 27
27 -
 28
28 -
 29
29 -
 30
30 -
 31
31 -
 32
32 -
 33
33 -
 34
34 -
 35
35 -
 36
36 -
 37
37 -
 38
38 -
 39
39 -
 40
40 -
41
-
42
-
43
-
44
-
45
-
46
-
47
-
48
-
49
-
50
-
51
-
52
-
53
-
54
-
55
-
56
-
57
-
58
-
59
-
60
-
61
-
62
-
63
-
64
-
65
-
66
-
67
-
68
-
69
-
70
-
71
-
72
-
73
-
74
-
75
-
76
-
77
-
78
-
79
-
80
-
81
-
82
-
83
-
84
-
85
-
86
-
87
-
88
-
89
-
90
-
91
-
92
-
93
-
94
-
95
-
96
-
97
-
98
-
99
-
100
-
101
-
102
-
103
-
104
-
105
-
106
-
107
-
108
 |
 |

MANAGEMENT’S DISCUSSION AND ANALYSIS OF
FINANCIAL CONDITION AND RESULTS OF OPERATIONS
28 CHEVRON CORPORATION 2006 ANNUAL REPORT
in signifi cantly lower average sales prices for the company’s
production of natural gas. (Refer to page 35 for the com-
pany’s average natural gas prices for the United States and
international regions.) Additionally, excess supply conditions
that exist in certain parts of the world cannot easily serve to
mitigate the relatively high-price conditions in the United
States and other markets because of the lack of infrastructure
to transport and receive liquefi ed natural gas.
To help address this regional imbalance between supply
and demand for natural gas, Chevron is planning increased
investments in long-term projects in areas of excess supply to
install infrastructure to produce and liquefy natural gas for
transport by tanker, along with investments and commitments
to regasify the product in markets where demand is strong
and supplies are not as plentiful. Due to the signifi cance of the
overall investment in these long-term projects, the natural gas
sales prices in the areas of excess supply (before the natural gas
is transferred to a company-owned or third-party processing
facility) are expected to remain well below sales prices for natu-
ral gas that is produced much nearer to areas of high demand
and can be transported in existing natural gas pipeline net-
works (as in the United States).
Besides the impact of the fl uctuation in price for crude
oil and natural gas, the longer-term trend in earnings for the
upstream segment is also a function of other factors, includ-
ing the company’s ability to fi nd or acquire and effi ciently
produce crude oil and natural gas, changes in fi scal terms,
and the cost of goods and services.
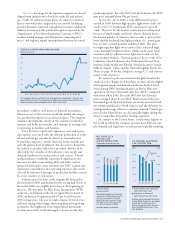
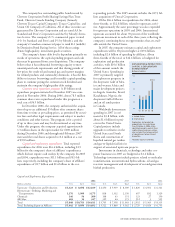
Chevron’s worldwide net oil-equivalent production in
2006, including volumes produced from oil sands and pro-
duction under an operating service agreement, averaged 2.67
million barrels per day, or 6 percent higher than production
in 2005. The increase between periods was largely due to
volumes associated with the acquisition of Unocal in August
2005. The company estimates that oil-equivalent production
in 2007 will average approximately 2.6 million barrels per
day. This estimate is subject to many uncertainties, including
quotas that may be imposed by OPEC, the price effect on
production volumes calculated under cost-recovery and vari-
able-royalty provisions of certain contracts, changes in fi scal
terms or restrictions on the scope of company operations,
and production disruptions that could be caused by severe
weather, local civil unrest and changing geopolitics. Future
production levels also are affected by the size and number
of economic investment opportunities and, for new large-
scale projects, the time lag between initial exploration and
the beginning of production. Most of Chevron’s upstream
investment is currently being made outside the United States.
Investments in upstream projects generally are made well in
advance of the start of the associated crude oil and natural
gas production.
Approximately 24 percent of the company’s net
oil-equivalent production in 2006 occurred in the OPEC-
member countries of Indonesia, Nigeria and Venezuela and
in the Partitioned Neutral Zone between Saudi Arabia and
Kuwait. In December 2006, OPEC admitted Angola as
a new member effective January 1, 2007. Oil-equivalent
production for 2006 in Angola represented 6 percent of
the company’s total. In October 2006, OPEC announced
its decision to reduce OPEC-member production quotas
by 1.2 million barrels of crude oil per day, or 4.4 percent,
from a production level of 27.5 million barrels, effective
November 1, 2006. In December 2006, OPEC announced an
additional quota reduction of 500,000 barrels of crude oil per
day, effective February 1, 2007. OPEC quotas did not signifi -
cantly affect Chevron’s production level in 2006. The impact
of quotas on the company’s production in 2007 is uncertain.
In October 2006, Chevron’s Boscan and LL-652 oper-
ating service agreements in Venezuela were converted to
Empresas Mixtas (i.e., joint stock contractual structures),
with Petróleos de Venezuela S.A., as majority shareholder.
Beginning in October, Chevron reported its equity share of
the Boscan and LL-652 production, which was approximately
90,000 barrels per day less than what the company previously
reported under the operating service agreements. The change
to the Empresa Mixta structure did not have a material effect
on the company’s results of operations, consolidated fi nancial
position or liquidity.
At the end of 2005 in certain onshore areas of Nigeria,
approximately 30,000 barrels per day of the company’s net
production capacity remained shut-in following civil unrest
and damage to production facilities that occurred in 2003.
By the end of 2006, the company had resumed operations
in portions of all the affected fi elds, and more than 20,000
barrels per day of production had been restored. In early
2007, additional production restoration activities continued
in the area; however, intermittent civil unrest could adversely
impact company operations in the future.
Refer to pages 30 through 32 for additional discussion of
the company’s upstream operations.
Downstream Earnings for the downstream segment
are closely tied to global and regional supply and demand
for refi ned products and the associated effects on indus-
try refi ning and marketing margins. Other factors include
the reliability and effi ciency of the company’s refi ning and
marketing network, the effectiveness of the crude-oil and
product-supply functions, and the economic returns on
invested capital. Profi tability can also be affected by the
volatility of charter expenses for the company’s shipping
operations, which are driven by the industry’s demand for
crude oil and product tankers. Other factors that are beyond