Chevron 2006 Annual Report Download - page 7
Download and view the complete annual report
Please find page 7 of the 2006 Chevron annual report below. You can navigate through the pages in the report by either clicking on the pages listed below, or by using the keyword search tool below to find specific information within the annual report.-
 1
1 -
 2
2 -
 3
3 -
 4
4 -
 5
5 -
 6
6 -
 7
7 -
 8
8 -
 9
9 -
 10
10 -
 11
11 -
 12
12 -
 13
13 -
 14
14 -
 15
15 -
 16
16 -
 17
17 -
 18
18 -
19
-
20
-
21
-
22
-
23
-
24
-
25
-
26
-
27
-
28
-
29
-
30
-
31
-
32
-
33
-
34
-
35
-
36
-
37
-
38
-
39
-
40
-
41
-
42
-
43
-
44
-
45
-
46
-
47
-
48
-
49
-
50
-
51
-
52
-
53
-
54
-
55
-
56
-
57
-
58
-
59
-
60
-
61
-
62
-
63
-
64
-
65
-
66
-
67
-
68
-
69
-
70
-
71
-
72
-
73
-
74
-
75
-
76
-
77
-
78
-
79
-
80
-
81
-
82
-
83
-
84
-
85
-
86
-
87
-
88
-
89
-
90
-
91
-
92
-
93
-
94
-
95
-
96
-
97
-
98
-
99
-
100
-
101
-
102
-
103
-
104
-
105
-
106
-
107
-
108
 |
 |
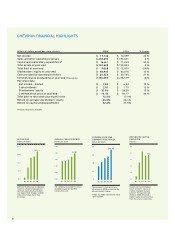
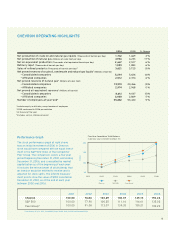
CHEVRON OPERATING HIGHLIGHTS1
2006 2005 % Change
Net production of crude oil and natural gas liquids (Thousands of barrels per day) 1,732 1,669 4 %
Net production of natural gas (Millions of cubic feet per day) 4,956 4,233 17 %
Net oil-equivalent production (Thousands of oil-equivalent barrels per day) 2,667 2,517 6 %
Refi nery input (Thousands of barrels per day) 1,989 1,883 6 %
Sales of refi ned products (Thousands of barrels per day)2 3,621 3,725 (3)%
Net proved reserves of crude oil, condensate and natural gas liquids3 (Millions of barrels)
— Consolidated companies 5,294 5,626 (6)%
— Affi liated companies 2,512 2,374 6 %
Net proved reserves of natural gas3 (Billions of cubic feet)
— Consolidated companies 19,910 20,466 (3)%
— Affi liated companies 2,974 2,968 0 %
Net proved oil-equivalent reserves3 (Millions of barrels)
— Conso lidated compa nies 8,612 9,037 (5)%
— Affi liated companies 3,008 2,869 5 %
Number of employees at year-end4 55,882 53,440 5 %
1 Includes equity in affiliates, except number of employees
2 2005 conformed to 2006 presentation
3 At the end of the year
4 Excludes service station personnel
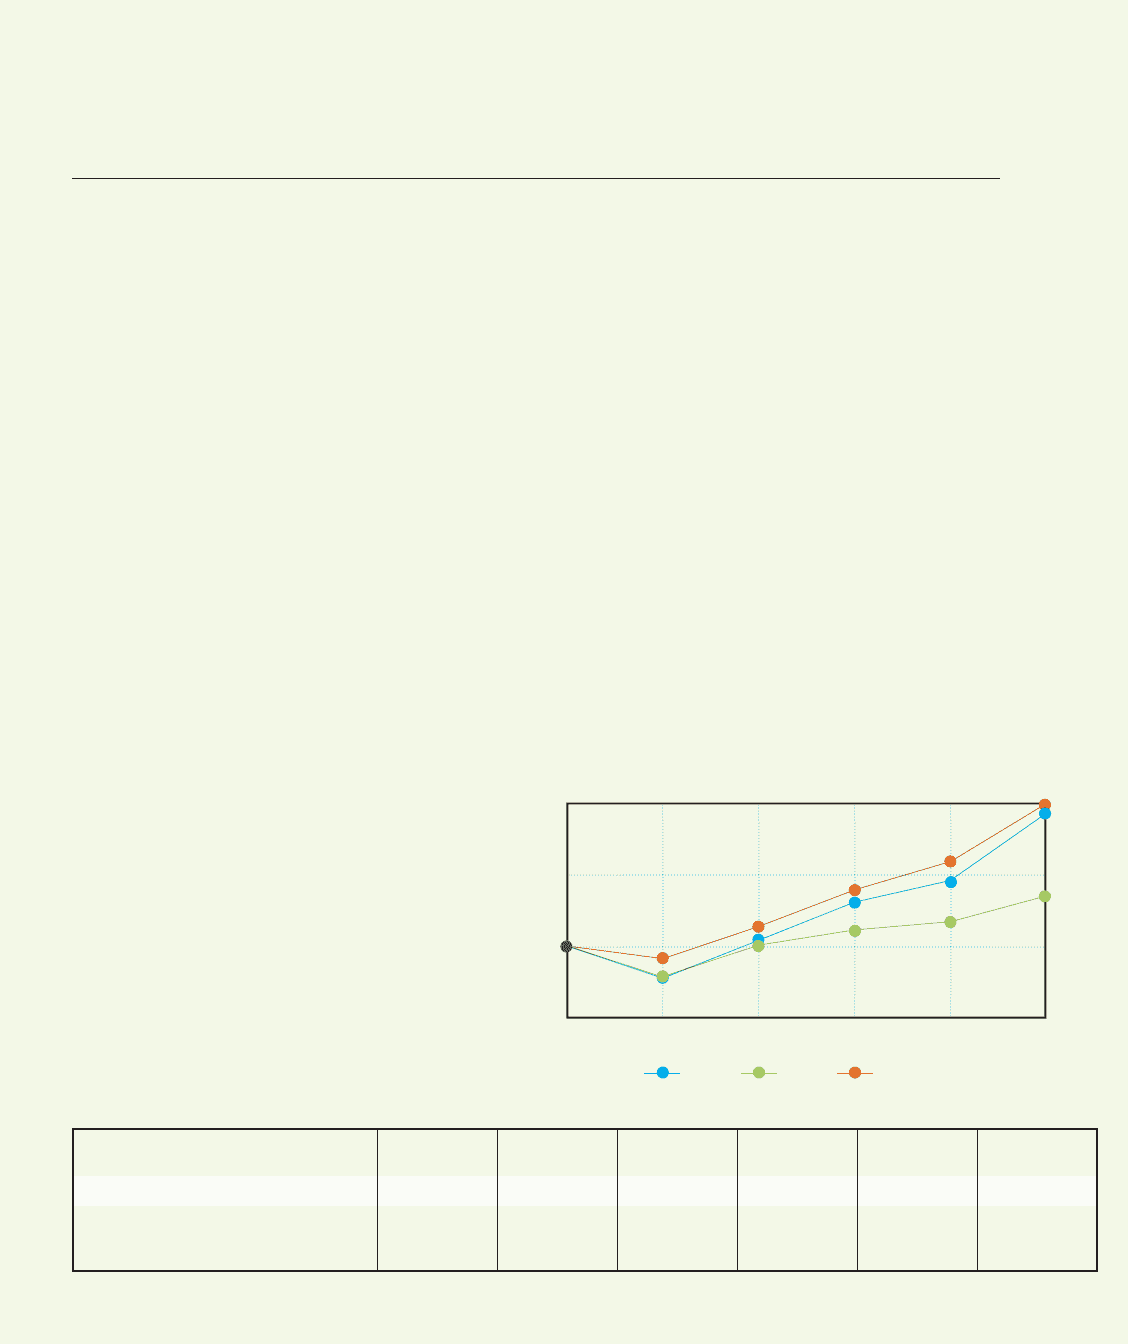
Performance Graph
The stock performance graph at right shows
how an initial investment of $100 in Chevron
stock would have compared with an equal invest-
ment in the S&P 500 Index or the Competitor
Peer Group. The comparison covers a fi ve-year
period beginning December 31, 2001, and ending
December 31, 2006, and is weighted by market
capitalization as of the beginning of each year.
It includes the reinvestment of all dividends that
an investor would be entitled to receive and is
adjusted for stock splits. The interim measure-
ment points show the value of $100 invested on
December 31, 2001, as of the end of each year
between 2002 and 2006.
=`
m\$
P
\Xi
:
ldl
c
X
k`
m\
K
f
k
X
c
I
\
k
liej
:Xc\e[Xip\Xij\e[\[;\Z\dY\i*(
)''
(,'
(''
,'
)''()'') )''* )''+ )'', )''-
;fccXij
:_\mife JG,'' G\\i>iflg!
*Peer Group: BP p.l.c.-ADS, ExxonMobil, Royal Dutch Shell plc-ADR and ConocoPhillips
Chevron
S&P 500
Peer Group*
2001
100.00
100.00
100.00
2002
76.86
77.90
91.08
2003
103.89
100. 25
113.07
2004
130.37
111.16
139.35
2005
145.15
116.61
159. 21
2006
194.24
135.02
199.29
5