Chevron 2006 Annual Report Download - page 21
Download and view the complete annual report
Please find page 21 of the 2006 Chevron annual report below. You can navigate through the pages in the report by either clicking on the pages listed below, or by using the keyword search tool below to find specific information within the annual report.-
 1
1 -
2
-
3
-
4
-
5
-
6
-
7
-
8
-
9
-
10
-
 11
11 -
 12
12 -
 13
13 -
 14
14 -
 15
15 -
 16
16 -
 17
17 -
 18
18 -
 19
19 -
 20
20 -
 21
21 -
 22
22 -
 23
23 -
 24
24 -
 25
25 -
 26
26 -
 27
27 -
 28
28 -
 29
29 -
 30
30 -
 31
31 -
32
-
33
-
34
-
35
-
36
-
37
-
38
-
39
-
40
-
41
-
42
-
43
-
44
-
45
-
46
-
47
-
48
-
49
-
50
-
51
-
52
-
53
-
54
-
55
-
56
-
57
-
58
-
59
-
60
-
61
-
62
-
63
-
64
-
65
-
66
-
67
-
68
-
69
-
70
-
71
-
72
-
73
-
74
-
75
-
76
-
77
-
78
-
79
-
80
-
81
-
82
-
83
-
84
-
85
-
86
-
87
-
88
-
89
-
90
-
91
-
92
-
93
-
94
-
95
-
96
-
97
-
98
-
99
-
100
-
101
-
102
-
103
-
104
-
105
-
106
-
107
-
108
 |
 |

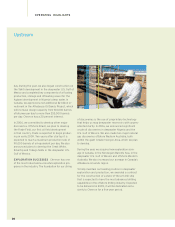
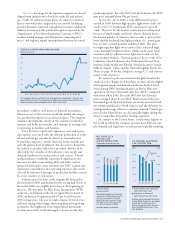
Upstream explores for and produces crude oil and
natural gas. Our strategy is to grow profi tably in
core areas and build new legacy positions. We have
major assets in the world’s most prolifi c regions,
and we are generally among the top producers
wherever we operate. We currently have more
than 35 major capital projects in various stages of
development, each representing an investment of
$500 million or more and each located in areas of
great resource potential. We also have one of the
industry’s leading exploration records. In 2006,
we had our fi fth year of successful exploration
results and added more than 1 billion barrels of
crude oil and natural gas resources. One leading
energy consulting fi rm said Chevron has one of the
strongest exploration portfolios in its peer group,
with proven experience in pushing the boundaries
of known technology.
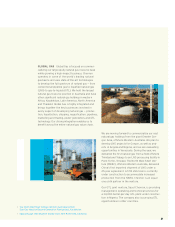
STRONG PERFORMANCE Upstream achieved
a number of milestones in 2006. During the year,
initial production began from Angola’s deepwater
Benguela and Lobito fi elds, part of the Benguela
Belize-Lobito Tomboco (BBLT) development. By
utilizing the BBLT infrastructure, production also
began from the nearby Landana North reservoir,
part of the Tombua-Landana development. We also
realized fi rst production from fi elds in Azerbaijan,
Trinidad and Tobago, and the U.K. North Sea. In
Kazakhstan, where the Tengizchevroil joint venture
is the largest private producer, signifi cant progress
was made on the Sour Gas Injection/Second Gener-
ation Plant project. Scheduled for startup in 2007,
the integrated projects are expected to increase
crude oil production capacity from the Tengiz and
Korolev fi elds from the current 300,000 barrels per
day to between 460,000 and 550,000 barrels per
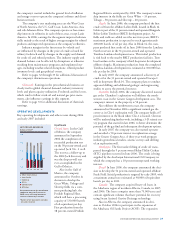
Upstream
At the end of 2006, worldwide net proved crude oil and natural gas reserves for consolidated
operations were 8.6 billion barrels of oil-equivalent and for affi liated operations were 3 bil-
lion barrels. Production averaged 2.67 net million barrels of oil-equivalent per day, including
volumes produced from oil sands and production under an operating service agreement. Major
producing areas include Angola, Australia, Indonesia, Kazakhstan, Nigeria, the Partitioned
Neutral Zone, Thailand, the United Kingdom, the United States and Venezuela. Major exploration
areas include western Africa, Australia, Brazil, Canada, the Gulf of Thailand, the Norwegian
Barents Sea, the international waters between Trinidad and Tobago and Venezuela, the U.K.
Atlantic Margin, and the U.S. Gulf of Mexico.
UPSTREAM
AT A GLANCE
19
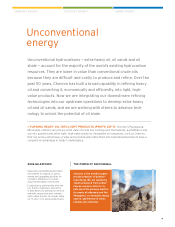
> Above both: Offshore platform, Benguela Belize fi elds, Angola.
19