Chevron 2006 Annual Report Download - page 90
Download and view the complete annual report
Please find page 90 of the 2006 Chevron annual report below. You can navigate through the pages in the report by either clicking on the pages listed below, or by using the keyword search tool below to find specific information within the annual report.-
 1
1 -
2
-
3
-
4
-
5
-
6
-
7
-
8
-
9
-
10
-
11
-
12
-
13
-
14
-
15
-
16
-
17
-
18
-
19
-
20
-
21
-
22
-
23
-
24
-
25
-
26
-
27
-
28
-
29
-
30
-
31
-
32
-
33
-
34
-
35
-
36
-
37
-
38
-
39
-
40
-
41
-
42
-
43
-
44
-
45
-
46
-
47
-
48
-
49
-
50
-
51
-
52
-
53
-
54
-
55
-
56
-
57
-
58
-
59
-
60
-
61
-
62
-
63
-
64
-
65
-
66
-
67
-
68
-
69
-
70
-
71
-
72
-
73
-
74
-
75
-
76
-
77
-
78
-
79
-
 80
80 -
 81
81 -
 82
82 -
 83
83 -
 84
84 -
 85
85 -
 86
86 -
 87
87 -
 88
88 -
 89
89 -
 90
90 -
 91
91 -
 92
92 -
 93
93 -
 94
94 -
 95
95 -
 96
96 -
 97
97 -
 98
98 -
 99
99 -
 100
100 -
101
-
102
-
103
-
104
-
105
-
106
-
107
-
108
 |
 |

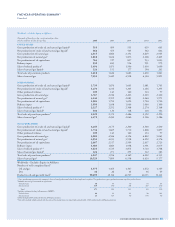
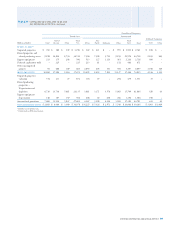
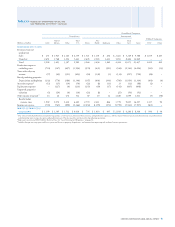
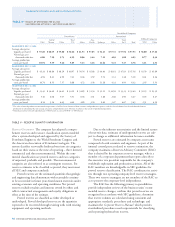
88 CHEVRON CORPORATION 2006 ANNUAL REPORT
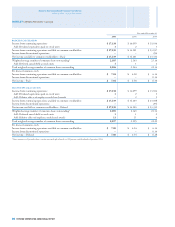
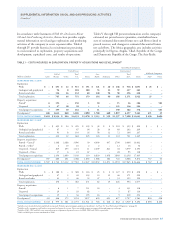
TABLE II – CAPITALIZED COSTS RELATED TO OIL AND GAS PRODUCING ACTIVITIES
Consolidated Companies
United States
International
Gu l f of Total A sia- Tota l Affi liated Companies
Millions of dollars Calif. Mexico Other U.S.
Africa Pacifi c Indonesia Other Int’l. Total TCO Other
AT DEC. 31, 2006
Unproved properties $ 770 $ 1,007 $ 370 $ 2,147 $ 342 $ 2,373 $ 707 $ 1,082 $ 4,504 $ 6,651 $ 112 $ –
Proved properties and
related producing assets 9,960 18,464 12,284 40,708 9,943 15,486 7,110 10,461 43,000 83,708 2,701 1,096
Support equipment 189 212 226 627 745 240 1,093 364 2,442 3,069 611 –
Deferred exploratory wells – 343 7 350 231 217 149 292 889 1,239 – –
Other uncompleted
projects 370 2,188 – 2,558 4,299 1,546 493 917 7,255 9,813 2,493 40
GROSS CAP. COSTS 11,289 22,214 12,887 46,390 15,560 19,862 9,552 13,116 58,090 104,480 5,917 1,136
Unproved properties
valuation 738 52 29 819 189 74 14 337 614 1,433 22 –
Proved producing
properties –
Depreciation and
depletion 7,082 14,468 6,880 28,430 4,794 5,273 4,971 6,087 21,125 49,555 541 109
Support equipment
depreciation 125 111 130 366 400 102 522 238 1,262 1,628 242 –
Accumulated provisions 7,945 14,631 7,039 29,615 5,383 5,449 5,507 6,662 23,001 52,616 805 109
NET CAPITALIZED COSTS $ 3,344 $ 7,583 $ 5,848 $ 16,775 $ 10,177 $ 14,413 $ 4,045 $ 6,454 $ 35,089 $ 51,864 $ 5,112 $ 1,027
AT DEC. 31, 2005*
Unproved properties $ 769 $ 1,077 $ 397 $ 2,243 $ 407 $ 2,287 $ 645 $ 983 $ 4,322 $ 6,565 $ 108 $ –
Proved properties and
related producing assets 9,546 18,283 11,467 39,296 8,404 14,928 6,613 9,627 39,572 78,868 2,264 1,213
Support equipment 204 193 230 627 715 426 1,217 356 2,714 3,341 549 –
Deferred exploratory wells – 284 5 289 245 154 173 248 820 1,109 – –
Other uncompleted
projects 149 782 209 1,140 2,878 790 427 946 5,041 6,181 2,332 –
GROSS CAP. COSTS 10,668 20,619 12,308 43,595 12,649 18,585 9,075 12,160 52,469 96,064 5,253 1,213
Unproved properties
valuation 736 90 22 848 162 69 – 318 549 1,397 17 –
Proved producing
properties –
Depreciation and
depletion 6,818 14,067 6,049 26,934 4,266 4,016 4,105 5,720 18,107 45,041 460 90
Support equipment
depreciation 140 119 149 408 317 88 680 222 1,307 1,715 213 –
Accumulated provisions 7,694 14,276 6,220 28,190 4,745 4,173 4,785 6,260 19,963 48,153 690 90
NET CAPITALIZED COSTS $ 2,974 $ 6,343 $ 6,088 $ 15,405 $ 7,904 $ 14,412 $ 4,290 $ 5,900 $ 32,506 $ 47,911 $ 4,563 $ 1,123
*Conformed to 2006 presentation.
geographic area includes activities principally in Australia,
Azerbaijan, Bangladesh, China, Kazakhstan, Myanmar, the
Partitioned Neutral Zone between Kuwait and Saudi Arabia,
the Philippines, and Thailand. The international “Other”
geographic category includes activities in Argentina, Brazil,
Canada, Colombia, Denmark, the Netherlands, Norway,
Trinidad and Tobago, Venezuela, the United Kingdom, and
other countries. Amounts for TCO represent Chevron’s 50
percent equity share of Tengizchevroil, an exploration and
production partnership in the Republic of Kazakhstan.
The affi liated companies “Other” amounts are composed
of a 30 percent equity share of Hamaca, an exploration and
production partnership in Venezuela and, effective October
2006, Chevron’s 39 percent interest and 25 percent interest
in Petroboscan and Petroindependiente, respectively. These
joint stock companies are involved in the development of the
Boscan and LL-652 fi elds in Venezuela, respectively.
Supplemental Information on Oil and Gas Producing Activities