Chevron 2006 Annual Report Download - page 91
Download and view the complete annual report
Please find page 91 of the 2006 Chevron annual report below. You can navigate through the pages in the report by either clicking on the pages listed below, or by using the keyword search tool below to find specific information within the annual report.-
 1
1 -
2
-
3
-
4
-
5
-
6
-
7
-
8
-
9
-
10
-
11
-
12
-
13
-
14
-
15
-
16
-
17
-
18
-
19
-
20
-
21
-
22
-
23
-
24
-
25
-
26
-
27
-
28
-
29
-
30
-
31
-
32
-
33
-
34
-
35
-
36
-
37
-
38
-
39
-
40
-
41
-
42
-
43
-
44
-
45
-
46
-
47
-
48
-
49
-
50
-
51
-
52
-
53
-
54
-
55
-
56
-
57
-
58
-
59
-
60
-
61
-
62
-
63
-
64
-
65
-
66
-
67
-
68
-
69
-
70
-
71
-
72
-
73
-
74
-
75
-
76
-
77
-
78
-
79
-
80
-
 81
81 -
 82
82 -
 83
83 -
 84
84 -
 85
85 -
 86
86 -
 87
87 -
 88
88 -
 89
89 -
 90
90 -
 91
91 -
 92
92 -
 93
93 -
 94
94 -
 95
95 -
 96
96 -
 97
97 -
 98
98 -
 99
99 -
 100
100 -
 101
101 -
102
-
103
-
104
-
105
-
106
-
107
-
108
 |
 |

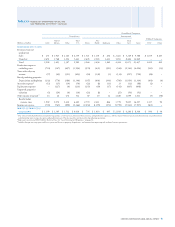
CHEVRON CORPORATION 2006 ANNUAL REPORT 89
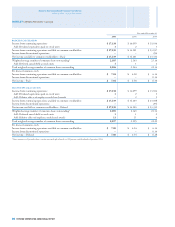
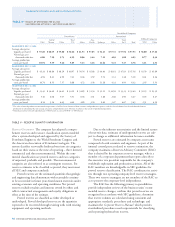
Consolidated Companies
United States International
Gulf of Total Asia- Total Affi liated Companies
Millions of dollars Calif. Mexico Other U.S.
Africa Pacifi c Indonesia Other Int’l. Total TCO Other
AT DEC. 31, 20041,2
Unproved properties $ 769 $ 380 $ 109 $ 1,258 $ 322 $ 211 $ – $ 970 $ 1,503 $ 2,761 $ 108 $ –
Proved properties and
related producing assets 9,198 16,814 8,730 34,742 7,394 7,598 5,731 9,253 29,976 64,718 2,183 963
Support equipment 211 175 208 594 513 127 1,123 361 2,124 2,718 496 –
Deferred exploratory wells – 225 – 225 213 81 – 152 446 671 – –
Other uncompleted
projects 91 400 169 660 2,050 605 351 391 3,397 4,057 1,749 149
GROSS CAP. COSTS 10,269 17,994 9,216 37,479 10,492 8,622 7,205 11,127 37,446 74,925 4,536 1,112
Unproved properties
valuation 734 111 27 872 118 67 – 294 479 1,351 15 –
Proved producing
properties –
Depreciation and
depletion 6,718 13,736 5,681 26,135 3,881 3,171 3,576 5,081 15,709 41,844 428 43
Support equipment
depreciation 148 107 139 394 268 60 658 206 1,192 1,586 190 –
Accumulated provisions 7,600 13,954 5,847 27,401 4,267 3,298 4,234 5,581 17,380 44,781 633 43
NET CAPITALIZED COSTS $ 2,669 $ 4,040 $ 3,369 $ 10,078 $ 6,225 $ 5,324 $ 2,971 $ 5,546 $ 20,066 $ 30,144 $ 3,903 $ 1,069
1 Includes assets held for sale.
2 Conformed to 2006 presentation.
TABLE II – CAPITALIZED COSTS RELATED TO OIL AND
GAS PRODUCING ACTIVITIES – Continued