Chevron 2006 Annual Report Download - page 87
Download and view the complete annual report
Please find page 87 of the 2006 Chevron annual report below. You can navigate through the pages in the report by either clicking on the pages listed below, or by using the keyword search tool below to find specific information within the annual report.-
 1
1 -
2
-
3
-
4
-
5
-
6
-
7
-
8
-
9
-
10
-
11
-
12
-
13
-
14
-
15
-
16
-
17
-
18
-
19
-
20
-
21
-
22
-
23
-
24
-
25
-
26
-
27
-
28
-
29
-
30
-
31
-
32
-
33
-
34
-
35
-
36
-
37
-
38
-
39
-
40
-
41
-
42
-
43
-
44
-
45
-
46
-
47
-
48
-
49
-
50
-
51
-
52
-
53
-
54
-
55
-
56
-
57
-
58
-
59
-
60
-
61
-
62
-
63
-
64
-
65
-
66
-
67
-
68
-
69
-
70
-
71
-
72
-
73
-
74
-
75
-
76
-
 77
77 -
 78
78 -
 79
79 -
 80
80 -
 81
81 -
 82
82 -
 83
83 -
 84
84 -
 85
85 -
 86
86 -
 87
87 -
 88
88 -
 89
89 -
 90
90 -
 91
91 -
 92
92 -
 93
93 -
 94
94 -
 95
95 -
 96
96 -
 97
97 -
98
-
99
-
100
-
101
-
102
-
103
-
104
-
105
-
106
-
107
-
108
 |
 |

CHEVRON CORPORATION 2006 ANNUAL REPORT 85
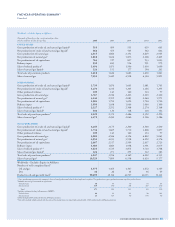
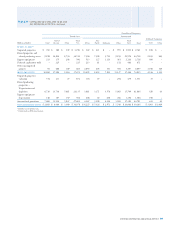
Worldwide – Includes Equity in Affi liates
Thousands of barrels per day, except natural gas data,
which is millions of cubic feet per day 2006 2005 2004 2003 2002
UNITED STATES
Gross production of crude oil and natural gas liquids1 510 499 555 619 665
Net production of crude oil and natural gas liquids1 462 455 505 562 602
Gross production of natural gas 2,115 1,860 2,191 2,619 2,945
Net production of natural gas2 1,810 1,634 1,873 2,228 2,405
Net production of oil equivalents 763 727 817 933 1,003
Refi nery input 939 845 914 951 979
Sales of refi ned products3 1,494 1,473 1,506 1,436 1,600
Sales of natural gas liquids 124 151 177 194 241
Total sales of petroleum products 1,618 1,624 1,683 1,630 1,841
Sales of natural gas 7,051 5,449 4,518 4,304 5,891
INTERNATIONAL
Gross production of crude oil and natural gas liquids1 1,739 1,676 1,645 1,681 1,765
Net production of crude oil and natural gas liquids1 1,270 1,214 1,205 1,246 1,295
Other produced volumes 109 143 140 114 97
Gross production of natural gas 3,767 2,726 2,203 2,203 2,120
Net production of natural gas2 3,146 2,599 2,085 2,064 1,971
Net production of oil equivalents 1,904 1,790 1,692 1,704 1,720
Refi nery input 1,050 1,038 1,044 1,040 1,100
Sales of refi ned products3,4 2,127 2,252 2,368 2,274 2,148
Sales of natural gas liquids4 102 120 118 118 142
Total sales of petroleum products4 2,229 2,372 2,486 2,392 2,290
Sales of natural gas4 3,478 2,450 2,040 2,106 3,286
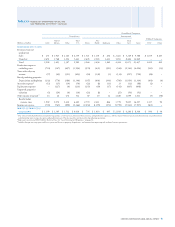
TOTAL WORLDWIDE
Gross production of crude oil and natural gas liquids1 2,249 2,175 2,200 2,300 2,430
Net production of crude oil and natural gas liquids1 1,732 1,669 1,710 1,808 1,897
Other produced volumes 109 143 140 114 97
Gross production of natural gas 5,882 4,586 4,394 4,822 5,065
Net production of natural gas2 4,956 4,233 3,958 4,292 4,376
Net production of oil equivalents 2,667 2,517 2,509 2,637 2,723
Refi nery input 1,989 1,883 1,958 1,991 2,079
Sales of refi ned products3,4 3,621 3,725 3,874 3,710 3,748
Sales of natural gas liquids4 226 271 295 312 383
Total sales of petroleum products4 3,847 3,996 4,169 4,022 4,131
Sales of natural gas4 10,529 7,899 6,558 6,410 9,177
Worldwide – Excludes Equity in Affi liates
Number of wells completed (net)5
Oil and gas 1,575 1,365 1,307 1,472 1,349
Dry 32 26 24 36 49
Productive oil and gas wells (net)5 50,695 49,508 44,707 48,155 50,320
1 Gross production represents the company’s share of total production before deducting lessors’ royalties. Net production is gross production minus royalties paid to lessors.
2 Includes natural gas consumed in operations:
United States 56 48 50 65 64
International 419 356 293 268 256
Total 475 404 343 333 320
3 Includes volumes for buy/sell contracts (MBPD):
United States 26 88 84 90 101
International 24 129 96 104 96
4 2002 through 2005 conformed to the 2006 presentation.
5 Net wells include wholly owned and the sum of fractional interests in partially owned wells. 2005 conformed to 2006 presentation.
FIVE-YEAR OPERATING SUMMARY1
Unaudited
CHEVRON CORPORATION 2006 ANNUAL REPORT 85