Chevron 2006 Annual Report Download - page 102
Download and view the complete annual report
Please find page 102 of the 2006 Chevron annual report below. You can navigate through the pages in the report by either clicking on the pages listed below, or by using the keyword search tool below to find specific information within the annual report.-
 1
1 -
2
-
3
-
4
-
5
-
6
-
7
-
8
-
9
-
10
-
11
-
12
-
13
-
14
-
15
-
16
-
17
-
18
-
19
-
20
-
21
-
22
-
23
-
24
-
25
-
26
-
27
-
28
-
29
-
30
-
31
-
32
-
33
-
34
-
35
-
36
-
37
-
38
-
39
-
40
-
41
-
42
-
43
-
44
-
45
-
46
-
47
-
48
-
49
-
50
-
51
-
52
-
53
-
54
-
55
-
56
-
57
-
58
-
59
-
60
-
61
-
62
-
63
-
64
-
65
-
66
-
67
-
68
-
69
-
70
-
71
-
72
-
73
-
74
-
75
-
76
-
77
-
78
-
79
-
80
-
81
-
82
-
83
-
84
-
85
-
86
-
87
-
88
-
89
-
90
-
91
-
 92
92 -
 93
93 -
 94
94 -
 95
95 -
 96
96 -
 97
97 -
 98
98 -
 99
99 -
 100
100 -
 101
101 -
 102
102 -
 103
103 -
 104
104 -
 105
105 -
 106
106 -
 107
107 -
 108
108
 |
 |

100 CHEVRON CORPORATION 2006 ANNUAL REPORT
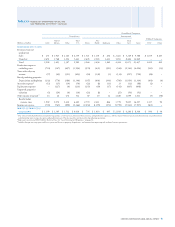
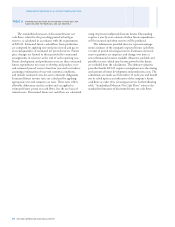
The changes in present values between years, which can
be signifi cant, refl ect changes in estimated proved reserve
quantities and prices and assumptions used in forecasting
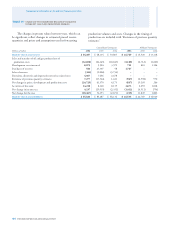
Consolidated Companies Affiliated Companies
Millions of dollars 2006 2005 2004 2006 2005 2004
PRESENT VALUE AT JANUARY 1 $ 84,287 $ 48,134 $ 50,805 $ 26,769 $ 14,920 $ 13,118
Sales and transfers of oil and gas produced net of
production costs (32,690) (26,145) (18,843) (3,180) (2,712) (1,602)
Development costs incurred 8,875 5,504 3,579 721 810 1,104
Purchases of reserves 580 25,307 58 1,767 – –
Sales of reserves (306) (2,006) (3,734) – – –
Extensions, discoveries and improved recovery less related costs 4,067 7,446 2,678 – – –
Revisions of previous quantity estimates 7,277 (13,564) 1,611 (967) (2,598) 970
Net changes in prices, development and production costs (24,725) 61,370 6,173 (837) 19,205 266
Accretion of discount 14,218 8,160 8,139 3,673 2,055 1,818
Net change in income tax 4,237 (29,919) (2,332) (1,412) (4,911) (754)
Net change for the year (18,467) 36,153 (2,671) (235) 11,849 1,802
PRESENT VALUE AT DECEMBER 31 $ 65,820 $ 84,287 $ 48,134 $ 26,534 $ 26,769 $ 14,920
TABLE VII – CHANGES IN THE STANDARDIZED MEASURE OF DISCOUNTED
FUTURE NET CASH FLOWS FROM PROVED RESERVES
production volumes and costs. Changes in the timing of
production are included with “Revisions of previous quantity
estimates.”
Supplemental Information on Oil and Gas Producing Activities