Chevron 2006 Annual Report Download - page 97
Download and view the complete annual report
Please find page 97 of the 2006 Chevron annual report below. You can navigate through the pages in the report by either clicking on the pages listed below, or by using the keyword search tool below to find specific information within the annual report.-
 1
1 -
2
-
3
-
4
-
5
-
6
-
7
-
8
-
9
-
10
-
11
-
12
-
13
-
14
-
15
-
16
-
17
-
18
-
19
-
20
-
21
-
22
-
23
-
24
-
25
-
26
-
27
-
28
-
29
-
30
-
31
-
32
-
33
-
34
-
35
-
36
-
37
-
38
-
39
-
40
-
41
-
42
-
43
-
44
-
45
-
46
-
47
-
48
-
49
-
50
-
51
-
52
-
53
-
54
-
55
-
56
-
57
-
58
-
59
-
60
-
61
-
62
-
63
-
64
-
65
-
66
-
67
-
68
-
69
-
70
-
71
-
72
-
73
-
74
-
75
-
76
-
77
-
78
-
79
-
80
-
81
-
82
-
83
-
84
-
85
-
86
-
 87
87 -
 88
88 -
 89
89 -
 90
90 -
 91
91 -
 92
92 -
 93
93 -
 94
94 -
 95
95 -
 96
96 -
 97
97 -
 98
98 -
 99
99 -
 100
100 -
 101
101 -
 102
102 -
 103
103 -
 104
104 -
 105
105 -
 106
106 -
 107
107 -
108
 |
 |

CHEVRON CORPORATION 2006 ANNUAL REPORT 95
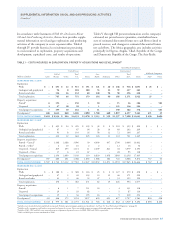
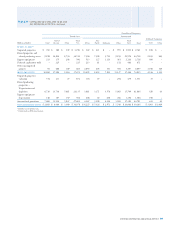
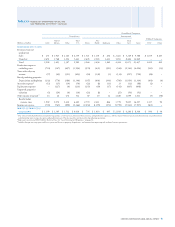
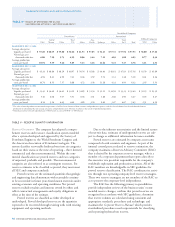
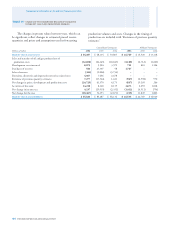
TABLE V – RESERVE QUANTITY INFORMATION – Continued
Mexico area was across several fi elds and based mainly on
reservoir analyses and assessments of well performance.
For affi liated companies, the 206 million-barrel increase
for TCO was based on an updated assessment of reservoir
performance for the Tengiz Field. Partially offsetting this
increase was a downward effect of higher year-end prices on
the variable royalty-rate calculation. Downward revisions also
occurred in other geographic areas because of the effect of
higher year-end prices on various production-sharing terms
and variable royalty calculations.
In 2005, net revisions reduced reserves by 239 million
and 24 million barrels for worldwide consolidated com-
panies and equity affi liates, respectively. For consolidated
companies, the net decrease was 199 million barrels in the
international areas and 40 million barrels in the United
States. The largest downward net revisions internationally
were 108 million barrels in Indonesia and 53 million barrels
in Kazakhstan, due primarily to the effect of higher year-end
prices on the calculation of reserves associated with production-
sharing and variable-royalty contracts. In the United States,
the 40 million-barrel reduction was across many fi elds in each
of the geographic sections. Most of the downward revision
for affi liated companies was a 19 million-barrel reduction in
Hamaca, attributable to revised government royalty provisions.
For TCO, the downward effect of higher year-end prices was
partially offset by increased reservoir performance.
In 2006, net revisions increased reserves by 39 million
and 84 million barrels for worldwide consolidated companies
and equity affi liates, respectively. International consolidated
companies accounted for the net increase of 39 million bar-
rels. The largest upward net revisions were 61 million barrels
in Indonesia and 27 million barrels in Thailand. In Indonesia,
the increase was the result of infi ll drilling and improved
steamfl ood performance. The upward revision in Thailand
refl ected additional drilling and development activity dur-
ing the year. These upward revisions were partially offset by
reductions in reservoir performance in Nigeria and the United
Kingdom, which decreased reserves by 43 million barrels and
by 32 million barrels, respectively. Most of the upward revi-
sion for affi liated companies was related to a 60 million barrel
increase in TCO as a result of improved reservoir performance.
Improved Recovery In 2006, improved recovery increased
liquids volumes worldwide by 83 million barrels for consoli-
dated companies. Reserves in the United States increased
52 million barrels, with California representing 49 million
barrels of the total increase due to steamfl ood expansion and
revised modeling activities. Internationally, improved recovery
increased reserves by 31 million barrels, with no single country
accounting for an increase of more than 10 million barrels.
Extensions and Discoveries In 2006, extensions and dis-
coveries increased liquids volumes worldwide by 107 million
barrels for consolidated companies. Reserves in Nigeria
increased by 27 million barrels due in part to the initial book-
ing of reserves for the Aparo Field. Additional drilling activities
contributed 19 million barrels in the United Kingdom and
14 million barrels in Argentina. In the United States, the
Gulf of Mexico added 25 million barrels, mainly the result of
the initial booking of the Great White Field in the deepwater
Perdido Fold Belt area.
Purchases In 2005, the acquisition of 572 million barrels
of liquids related solely to the acquisition of Unocal in August.
About three-fourths of the 376 million barrels acquired in
the international areas were represented by volumes in
Azerbaijan and Thailand. Most volumes acquired in the
United States were in Texas and Alaska.
In 2006, acquisitions increased liquids volumes world-
wide by 21 million barrels for consolidated companies and
119 million barrels for equity affi liates. For consolidated
companies, the amount was mainly the result of new agree-
ments in Nigeria, which added 13 million barrels of reserves.
The other-equity-affi liates quantity refl ects the result of the
conversion of Boscan and LL-652 operations to joint stock
companies in Venezuela.
Sales In 2004, sales of liquids volumes reduced reserves
of consolidated companies by 179 million barrels. Sales
totaled 130 million barrels in the United States and 33 mil-
lion barrels in the “Other” international region. Sales in the
“Other” region of the United States totaled 103 million bar-
rels, with two fi elds accounting for approximately one-half
of the volume. The 27 million barrels sold in the Gulf of
Mexico refl ect the sale of a number of Shelf properties. The
“Other” international sales include the disposal of western
Canada properties and several fi elds in the United Kingdom.
All the sales were associated with the company’s program to
dispose of assets deemed nonstrategic to the portfolio of pro-
ducing properties.
In 2005, sales of 58 million barrels in the “Other” inter-
national area related to the disposition of the former Unocal
operations onshore in Canada.
In 2006, sales decreased reserves by 15 million barrels
due to the conversion of the LL-652 risked service agreement
to a joint stock company in Venezuela.