Chevron 2006 Annual Report Download - page 69
Download and view the complete annual report
Please find page 69 of the 2006 Chevron annual report below. You can navigate through the pages in the report by either clicking on the pages listed below, or by using the keyword search tool below to find specific information within the annual report.-
 1
1 -
2
-
3
-
4
-
5
-
6
-
7
-
8
-
9
-
10
-
11
-
12
-
13
-
14
-
15
-
16
-
17
-
18
-
19
-
20
-
21
-
22
-
23
-
24
-
25
-
26
-
27
-
28
-
29
-
30
-
31
-
32
-
33
-
34
-
35
-
36
-
37
-
38
-
39
-
40
-
41
-
42
-
43
-
44
-
45
-
46
-
47
-
48
-
49
-
50
-
51
-
52
-
53
-
54
-
55
-
56
-
57
-
58
-
 59
59 -
 60
60 -
 61
61 -
 62
62 -
 63
63 -
 64
64 -
 65
65 -
 66
66 -
 67
67 -
 68
68 -
 69
69 -
 70
70 -
 71
71 -
 72
72 -
 73
73 -
 74
74 -
 75
75 -
 76
76 -
 77
77 -
 78
78 -
 79
79 -
80
-
81
-
82
-
83
-
84
-
85
-
86
-
87
-
88
-
89
-
90
-
91
-
92
-
93
-
94
-
95
-
96
-
97
-
98
-
99
-
100
-
101
-
102
-
103
-
104
-
105
-
106
-
107
-
108
 |
 |

CHEVRON CORPORATION 2006 ANNUAL REPORT 67CHEVRON CORPORATION 2006 ANNUAL REPORT 67
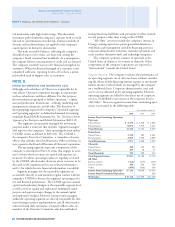
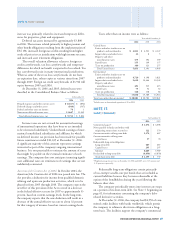
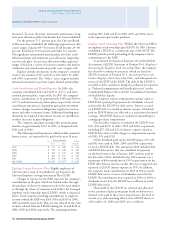
NOTE 12. INVESTMENTS AND ADVANCES – Continued
The following table provides summarized fi nancial information on a 100 percent basis for all equity affiliates as well as
Chevron’s total share, which includes Chevron loans to affi liates of $3,915 at December 31, 2006.
Affi liates Chevron Share
Year ended December 31 2006 2005 2004 2006 2005 2004
Tota l revenue s $ 73,746 $ 64,642 $ 55,152 $ 35,695 $ 31,252 $ 25,916
Income before income tax expense 10,973 7,883 5,309 5,295 4,165 3,015
Net income 7,905 6,645 4,441 4,072 3,534 2,582
At December 31
Current assets $ 19,769 $ 19,903 $ 16,506 $ 8,944 $ 8,537 $ 7,540
Noncurrent assets 49,896 46,925 38,104 18,575 17,747 15,567
Current liabilities 15,254 13,427 10,949 6,818 6,034 4,962
Noncurrent liabilities 24,059 26,579 22,261 3,902 4,906 4,520
Net equity $ 30,352 $ 26,822 $ 21,400 $ 16,799 $ 15,344 $ 13,625
NOTE 13.
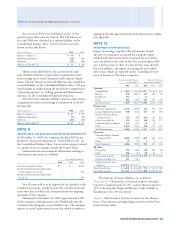
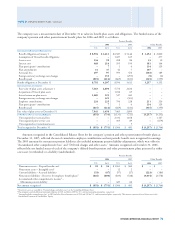
PROPERTIES, PLANT AND EQUIPMENT1
At December 31 Year ended December 31
Gross Investment at Cost Net Investment Additions at Cost2 Depreciation Expense3,4
2006 2005 2004 2006 2005 2004 2006 2005 2004 2006 2005 2004
Upstream
United States $ 46,191 $ 43,390 $ 37,329 $ 16,706 $ 15,327 $ 10,047 $ 3,739 $ 2,160 $ 1,584 $ 2,374 $ 1,869 $ 1,508
International 61,281 54,497 38,721 37,730 34,311 21,192 7,290 4,897 3,090 3,888 2,804 2,180
Total Upstream 107,472 97,887 76,050 54,436 49,638 31,239 11,029 7,057 4,674 6,262 4,673 3,688
Downstream
United States 14,553 13,832 12,826 6,741 6,169 5,611 1,109 793 482 474 461 490
International 11,036 11,235 10,843 5,233 5,529 5,443 532 453 441 551 550 572
Tota l Downstrea m 25,589 25,067 23,669 11,974 11,698 11,054 1,641 1,246 923 1,025 1,011 1,062
Chemicals
United States 645 624 615 289 282 292 25 12 12 19 19 20
International 771 721 725 431 402 392 54 43 27 24 23 26
Total Chemicals 1,416 1,345 1,340 720 684 684 79 55 39 43 42 46
All Other5
United States 3,243 3,127 2,877 1,709 1,655 1,466 270 199 314 171 186 158
International 27 20 18 19 15 15 8 4 2 5 1 3
Total All Other 3,270 3,147 2,895 1,728 1,670 1,481 278 203 316 176 187 161
Total United States 64,632 60,973 53,647 25,445 23,433 17,416 5,143 3,164 2,392 3,038 2,535 2,176
Total International 73,115 66,473 50,307 43,413 40,257 27,042 7,884 5,397 3,560 4,468 3,378 2,781
Total $ 137,747 $ 127,446 $ 103,954 $ 68,858 $ 63,690 $ 44,458 $ 13,027 $ 8,561 $ 5,952 $ 7,506 $ 5,913 $ 4,957
1 Includes assets acquired in connection with the acquisition of Unocal Corporation in August 2005. Refer to Note 2, beginning on page 58, for additional information.
2 Net of dry hole expense related to prior years’ expenditures of $120, $28 and $58 in 2006, 2005 and 2004, respectively.
3 Depreciation expense includes accretion expense of $275, $187 and $93 in 2006, 2005 and 2004, respectively.
4 Depreciation expense includes discontinued operations of $22 in 2004.
5 Primarily mining operations, power generation businesses, real estate assets and management information systems.
NOTE 14.
ACCOUNTING FOR BUY/SELL CONTRACTS
The company adopted the accounting prescribed by EITF
Issue No. 04-13, Accounting for Purchases and Sales of Inven-
tory with the Same Counterparty (Issue 04-13) on a prospective
basis from April 1, 2006. Issue 04-13 requires that two or
more legally separate exchange transactions with the same
counterparty, including buy/sell transactions, be combined
and considered as a single arrangement for purposes of apply-
ing the provisions of Accounting Principles Board Opinion
No. 29, Accounting for Nonmonetary Transactions, when
the transactions are entered into “in contemplation” of one
another. In prior periods, the company accounted for buy/sell
transactions in the Consolidated Statement of Income as a
monetary transaction – purchases were reported as “Purchased
crude oil and products”; sales were reported as “Sales and
other operating revenues.”
With the company’s adoption of Issue 04-13, buy/sell
transactions beginning in the second quarter 2006 are netted
against each other on the Consolidated Statement of Income,
with no effect on net income. Amounts associated with buy/
sell transactions in periods prior to the second quarter 2006
are shown as a footnote to the Consolidated Statement of
Income on page 51.