Chevron 2006 Annual Report Download - page 33
Download and view the complete annual report
Please find page 33 of the 2006 Chevron annual report below. You can navigate through the pages in the report by either clicking on the pages listed below, or by using the keyword search tool below to find specific information within the annual report.-
 1
1 -
2
-
3
-
4
-
5
-
6
-
7
-
8
-
9
-
10
-
11
-
12
-
13
-
14
-
15
-
16
-
17
-
18
-
19
-
20
-
21
-
22
-
 23
23 -
 24
24 -
 25
25 -
 26
26 -
 27
27 -
 28
28 -
 29
29 -
 30
30 -
 31
31 -
 32
32 -
 33
33 -
 34
34 -
 35
35 -
 36
36 -
 37
37 -
 38
38 -
 39
39 -
 40
40 -
 41
41 -
 42
42 -
 43
43 -
44
-
45
-
46
-
47
-
48
-
49
-
50
-
51
-
52
-
53
-
54
-
55
-
56
-
57
-
58
-
59
-
60
-
61
-
62
-
63
-
64
-
65
-
66
-
67
-
68
-
69
-
70
-
71
-
72
-
73
-
74
-
75
-
76
-
77
-
78
-
79
-
80
-
81
-
82
-
83
-
84
-
85
-
86
-
87
-
88
-
89
-
90
-
91
-
92
-
93
-
94
-
95
-
96
-
97
-
98
-
99
-
100
-
101
-
102
-
103
-
104
-
105
-
106
-
107
-
108
 |
 |
CHEVRON CORPORATION 2006 ANNUAL REPORT 31
benefi ts were increases in operating expense and expenses
for depreciation and exploration. Included in the operating
expense increases were costs associated with the carryover
effects of hurricanes in the Gulf of Mexico in 2005.
Income of $4.2 billion in 2005 was $230 million higher
than 2004. The 2004 amount included gains of approxi-
mately $400 million from asset sales. Higher prices for crude
oil and natural gas in 2005 and fi ve months of earnings from
the former Unocal operations contributed approximately $2
billion to the increase between periods. Approximately 90
percent of this amount related to the effects of higher prices
on heritage-Chevron production. These benefi ts were sub-
stantially offset by the adverse effects of lower production,
higher operating expenses and higher depreciation expense
associated with the heritage-Chevron properties.
The company’s average realization for crude oil and
natural gas liquids in 2006 was $56.66 per barrel, compared
with $46.97 in 2005 and $34.12 in 2004. The average
natural gas realization was $6.29 per thousand cubic feet in
2006, compared with $7.43 and $5.51 in 2005 and 2004,
respectively.
Net oil-equivalent production in 2006 averaged 763,000
barrels per day, up 5 percent from 2005 and down 7 percent
from 2004. The increase between 2005 and 2006 was due to
the full-year benefi t of production from the former Unocal
properties. The decrease from 2004 was associated mainly
with the effects of hurricanes, property sales and normal fi eld
declines, partially offset by additional volumes from the for-
mer Unocal properties.
The net liquids component of oil-equivalent produc-
tion for 2006 averaged 462,000 barrels per day, an increase
of approximately 2 percent from 2005 and a decrease of 9
percent from 2004. Net natural gas production averaged 1.8
billion cubic feet per day in 2006, up 11 percent from 2005
and down 3 percent from 2004.
Refer to the “Selected Operating Data” table, on page
35, for the three-year comparative production volumes in the
United States.
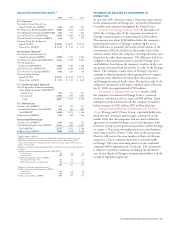
International Upstream – Exploration and Production
Millions of dollars 2006 2005 2004
Income From Continuing Operations* $ 8,872 $ 7,556 $ 5,622
Income From Discontinued Operations – – 224
Total Income* $ 8,872 $ 7,556 $ 5,846
*Includes Foreign Currency Effects: $ (371) $ 14 $ (129)
International upstream income of approximately $8.9
billion in 2006 increased $1.3 billion from 2005. Earnings
in 2006 benefi ted approximately $3.0 billion from higher
prices for crude oil and natural gas and an additional seven
months of production from the former Unocal properties.
About 70 percent of this benefi t was associated with the
impact of higher prices. Substantially offsetting these benefi ts
were increases in depreciation expense, operating expense and
exploration expense. Also adversely affecting 2006 income
were higher taxes related to an increase in tax rates in the
U.K. and Venezuela and settlement of tax claims and other
tax items in Venezuela, Angola and Chad. Foreign cur-
rency effects reduced earnings by $371 million in 2006, but
increased income $14 million in 2005.
Income in 2005 was approximately $7.5 billion, com-
pared with $5.8 billion in 2004, which included gains of
approximately $850 million from property sales. Higher
prices for crude oil and natural gas in 2005 and fi ve months
of earnings from the former Unocal operations increased
income approximately $2.9 billion between periods. About
80 percent of this benefi t arose from the effects of higher
prices on heritage-Chevron production. Partially offsetting
these benefi ts were higher expenses between periods for
certain income tax items, including the absence of a $200
million benefi t in 2004 relating to changes in income tax
laws. Foreign currency effects increased income $14 million
in 2005 but reduced income $129 million in 2004.
The company’s average realization for crude oil and natu-
ral gas liquids in 2006 was $57.65 per barrel, compared with
$47.59 in 2005 and $34.17 in 2004. The average natural gas
realization was $3.73 per thousand cubic feet in 2006, com-
pared with $3.19 and $2.68 in 2005 and 2004, respectively.
Net oil-equivalent production of 1.9 million barrels per
day in 2006, including about 100,000 net barrels per day
from oil sands in Canada and production under an operat-
ing service agreement in Venezuela prior to its conversion to
a joint stock company, increased about 6 percent from 2005
and 13 percent from 2004. This trend was largely the result
of the effects of the Unocal acquisition in August 2005,
partially offset by the effect of normal fi eld declines and
property sales in 2004.
The net liquids component of oil-equivalent produc-
tion was 1.4 million barrels per day in 2006, an increase of
approximately 2 percent from 2005 and 2004. Net natural gas
production of 3.1 billion cubic feet per day in 2006 was up 21
percent and 51 percent from 2005 and 2004, respectively.
'
(,''
()''
0''
-''
*''
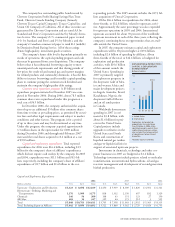
<OGCFI8K@FE<OG<EJ<J
D`cc`fejf][fccXij
Le`k\[JkXk\j
@ek\ieXk`feXc
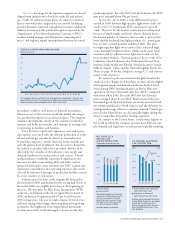
<ogcfiXk`fe\og\ej\j`eZi\Xj\[
XYflk-''d`cc`fe#dX`ecp[l\kf
_`^_\iXdflekj]fin\ccni`k\$f]]j
Xe[^\fcf^`ZXe[^\fg_pj`ZXc
Zfjkj]fifg\iXk`fejflkj`[\k_\
Le`k\[JkXk\j%
'*') '+ ', '-
(#*-+
'%'
(,%'
0%'
()%'
-%'
*%'
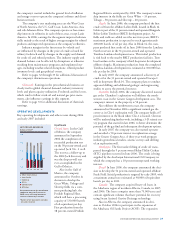
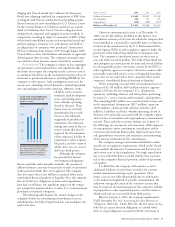
NFIC;N@;<<OGCFI8K@FE
GIF;L:K@FE<8IE@E>J!
9`cc`fejf][fccXij
<Xie`e^j`eZi\Xj\[`e)''-fe
_`^_\igif[lZk`femfcld\jXe[
Zil[\f`cgi`Z\j%
!9\]fi\k_\ZldlcXk`m\\]]\Zkf]
Z_Xe^\j`eXZZflek`e^gi`eZ`gc\j
i\Zfi[\[`e)''*
Le`k\[JkXk\j
@ek\ieXk`feXc
'*') '+ ', '-
(*%(