Chevron 2006 Annual Report Download - page 70
Download and view the complete annual report
Please find page 70 of the 2006 Chevron annual report below. You can navigate through the pages in the report by either clicking on the pages listed below, or by using the keyword search tool below to find specific information within the annual report.-
 1
1 -
2
-
3
-
4
-
5
-
6
-
7
-
8
-
9
-
10
-
11
-
12
-
13
-
14
-
15
-
16
-
17
-
18
-
19
-
20
-
21
-
22
-
23
-
24
-
25
-
26
-
27
-
28
-
29
-
30
-
31
-
32
-
33
-
34
-
35
-
36
-
37
-
38
-
39
-
40
-
41
-
42
-
43
-
44
-
45
-
46
-
47
-
48
-
49
-
50
-
51
-
52
-
53
-
54
-
55
-
56
-
57
-
58
-
59
-
 60
60 -
 61
61 -
 62
62 -
 63
63 -
 64
64 -
 65
65 -
 66
66 -
 67
67 -
 68
68 -
 69
69 -
 70
70 -
 71
71 -
 72
72 -
 73
73 -
 74
74 -
 75
75 -
 76
76 -
 77
77 -
 78
78 -
 79
79 -
 80
80 -
81
-
82
-
83
-
84
-
85
-
86
-
87
-
88
-
89
-
90
-
91
-
92
-
93
-
94
-
95
-
96
-
97
-
98
-
99
-
100
-
101
-
102
-
103
-
104
-
105
-
106
-
107
-
108
 |
 |

68 CHEVRON CORPORATION 2006 ANNUAL REPORT68 CHEVRON CORPORATION 2006 ANNUAL REPORT
Notes to the Consolidated Financial Statements
Millions of dollars, except per-share amounts
NOTE 15.
LITIGATION
MTBE Chevron and many other companies in the petroleum
industry have used methyl tertiary butyl ether (MTBE) as
a gasoline additive. Chevron is a party to approximately 75
lawsuits and claims, the majority of which involve numerous
other petroleum marketers and refi ners, related to the use of
MTBE in certain oxygenated gasolines and the alleged seepage
of MTBE into groundwater. Resolution of these actions may
ultimately require the company to correct or ameliorate the
alleged effects on the environment of prior release of MTBE
by the company or other parties. Additional lawsuits and
claims related to the use of MTBE, including personal-injury
claims, may be fi led in the future.
The company’s ultimate exposure related to these lawsuits
and claims is not currently determinable, but could be material to
net income in any one period. The company currently does not use
MTBE in the manufacture of gasoline in the United States.
RFG Patent Fourteen purported class actions were brought
by consumers of reformulated gasoline (RFG) alleging that
Unocal misled the California Air Resources Board into
adopting standards for composition of RFG that overlapped
with Unocal’s undisclosed and pending patents. Eleven
lawsuits are now consolidated in U.S. District Court for
the Central District of California and three are consoli-
dated in California State Court. Unocal is alleged to have
monopolized, conspired and engaged in unfair methods of
competition, resulting in injury to consumers of RFG. Plain-
tiffs in both consolidated actions seek unspecifi ed actual and
punitive damages, attorneys’ fees, and interest on behalf of an
alleged class of consumers who purchased “summertime” RFG
in California from January 1995 through August 2005. Unocal
believes it has valid defenses and intends to vigorously defend
against these lawsuits. The company’s potential exposure related
to these lawsuits cannot currently be estimated.
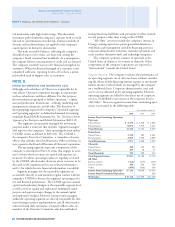
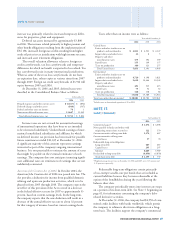
NOTE 16.
TAXES
Year ended December 31
2006 2005 2004
Taxes on income*
U.S. federal
Current $ 2,828 $ 1,459 $ 2,246
Deferred 200 567 (290)
State and local 581 409 345
Total United States 3,609 2,435 2,301
International
Current 11,030 7,837 5,150
Deferred 199 826 66
Total International 11,229 8,663 5,216
Total taxes on income $ 14,838 $ 11,098 $ 7,517
* Excludes income tax expense of $100 related to discontinued operations for 2004.
In 2006, the before-tax income for U.S. operations,
including related corporate and other charges, was $9,131,
compared with a before-tax income of $6,733 and $7,776 in
2005 and 2004, respectively. For international operations,
before-tax income was $22,845, $18,464 and $12,775 in
2006, 2005 and 2004, respectively. U.S. federal income tax
expense was reduced by $116, $289 and $176 in 2006, 2005
and 2004, respectively, for business tax credits.
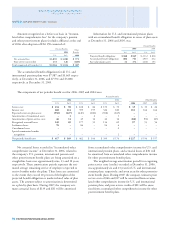
The reconciliation between the U.S. statutory federal
income tax rate and the company’s effective income tax rate is
explained in the table below:
Year ended December 31
2006 2005 2004
U.S. statutory federal income tax rate 35.0% 35.0% 35.0%
Effect of income taxes from inter-
national operations at rates different
from the U.S. statutory rate 10.3 9.2 5.3
State and local taxes on income, net
of U.S. federal income tax benefi t 1.0 1.0 0.9
Prior-year tax adjustments 0.9 0.1 (1.0)
Tax credits (0.4) (1.1) (0.9)
Effects of enacted changes in tax laws 0.3 – (0.6)
Capital loss tax benefi t – (0.1) (2.1)
Other (0.7) – –
Effective tax rate 46.4% 44.1% 36.6%
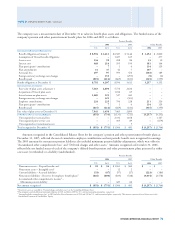
The company records its deferred taxes on a tax-
jurisdiction basis and classifi es those net amounts as current
or noncurrent based on the balance sheet classifi cation of the
related assets or liabilities.
The reported deferred tax balances are composed of the
following:
At December 31
2006 2005
Deferred tax liabilities
Properties, plant and equipment $ 16,054 $ 14,220
Investments and other 2,137 1,469
Total deferred tax liabilities 18,191 15,689
Deferred tax assets
Abandonment/environmental reserves (2,925) (2,083)
Employee benefi ts (2,707) (1,250)
Tax loss carryforwards (1,509) (1,113)
Capital losses (246) (246)
Deferred credits (1,670) (1,618)
Foreign tax credits (1,916) (1,145)
Inventory (378) (182)
Other accrued liabilities (375) (240)
Miscellaneous (1,144) (1,237)
Total deferred tax assets (12,870) (9,114)
Deferred tax assets valuation allowance 4,391 3,249
Total deferred taxes, net $ 9,712 $ 9,824
In 2006, deferred tax liabilities increased by approxi-
mately $2,500 from the amount reported in 2005. The