Chevron 2006 Annual Report Download - page 37
Download and view the complete annual report
Please find page 37 of the 2006 Chevron annual report below. You can navigate through the pages in the report by either clicking on the pages listed below, or by using the keyword search tool below to find specific information within the annual report.-
 1
1 -
2
-
3
-
4
-
5
-
6
-
7
-
8
-
9
-
10
-
11
-
12
-
13
-
14
-
15
-
16
-
17
-
18
-
19
-
20
-
21
-
22
-
23
-
24
-
25
-
26
-
 27
27 -
 28
28 -
 29
29 -
 30
30 -
 31
31 -
 32
32 -
 33
33 -
 34
34 -
 35
35 -
 36
36 -
 37
37 -
 38
38 -
 39
39 -
 40
40 -
 41
41 -
 42
42 -
 43
43 -
 44
44 -
 45
45 -
 46
46 -
 47
47 -
48
-
49
-
50
-
51
-
52
-
53
-
54
-
55
-
56
-
57
-
58
-
59
-
60
-
61
-
62
-
63
-
64
-
65
-
66
-
67
-
68
-
69
-
70
-
71
-
72
-
73
-
74
-
75
-
76
-
77
-
78
-
79
-
80
-
81
-
82
-
83
-
84
-
85
-
86
-
87
-
88
-
89
-
90
-
91
-
92
-
93
-
94
-
95
-
96
-
97
-
98
-
99
-
100
-
101
-
102
-
103
-
104
-
105
-
106
-
107
-
108
 |
 |

CHEVRON CORPORATION 2006 ANNUAL REPORT 35
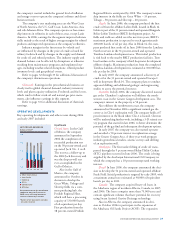
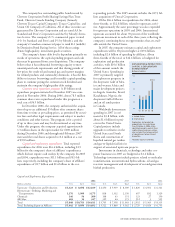
SELECTED OPERATING DATA1,2
2006 2005 2004
U.S. Upstream3
Net Crude Oil and Natural Gas
Liquids Production (MBPD) 462 455 505
Net Natural Gas Production (MMCFPD)4 1,810 1,634 1,873
Net Oil-Equivalent Production (MBOEPD) 763 727 817
Sales of Natural Gas (MMCFPD) 7,051 5,449 4,518
Sales of Natural Gas Liquids (MBPD) 124 151 177
Revenues From Net Production
Liquids ($/Bbl) $ 56.66 $ 46.97 $ 34.12
Natural Gas ($/MCF) $ 6.29 $ 7.43 $ 5.51
International Upstream3
Net Crude Oil and Natural Gas
Liquids Production (MBPD) 1,270 1,214 1,205
Net Natural Gas Production (MMCFPD)4 3,146 2,599 2,085
Net Oil-Equivalent
Production (MBOEPD)5 1,904 1,790 1,692
Sales Natural Gas (MMCFPD) 3,478 2,450 2,039
Sales Natural Gas Liquids (MBPD) 102 120 118
Revenues From Liftings
Liquids ($/Bbl) $ 57.65 $ 47.59 $ 34.17
Natural Gas ($/MCF) $ 3.73 $ 3.19 $ 2.68
U.S. and International Upstream3
Net Oil-Equivalent Production Including
Other Produced Volumes (MBOEPD)4,5
United States 763 727 817
International 1,904 1,790 1,692
Total 2,667 2,517 2,509
U.S. Downstream
Gasoline Sales (MBPD)6 712 709 701
Other Refined Products Sales (MBPD) 782 764 805
Total (MBPD)7 1,494 1,473 1,506
Refinery Input (MBPD) 939 845 914
International Downstream
Gasoline Sales (MBPD)6 595 662 715
Other Refined Products Sales (MBPD) 1,532 1,590 1,653
Total (MBPD)7,8 2,127 2,252 2,368
Refi nery Input (MBPD) 1,050 1,038 1,044
1 Includes equity in affi liates.
2 MBPD = Thousands of barrels per day; MMCFPD = Millions of cubic feet per day;
MBOEPD = Thousands of barrels of oil equivalents per day; Bbl = Barrel; MCF =
Thousands of cubic feet. Oil-equivalent gas (OEG) conversion ratio is 6,000 cubic feet
of gas = 1 barrel of oil.
3 Includes net production beginning August 2005, for properties associated with acquisition
of Unocal.
4 Includes natural gas consumed in operations (MMCFPD):
United States 56 48 50
International 419 356 293
5 Includes other produced volumes (MBPD):
Athabasca Oil Sands – Net 27 32 27
Boscan Operating Service Agreement 82 111 113
109 143 140
6 Includes branded and unbranded gasoline.
7 Includes volumes for buy/sell contracts (MBPD):
United States 26 88 84
International 24 129 96
8 Includes sales of affi liates (MBPD): 492 498 502
INFORMATION RELATED TO INVESTMENT IN
DYNEGY INC.
At year-end 2006, Chevron owned a 19 percent equity interest
in the common stock of Dynegy Inc., a provider of electricity
to markets and customers throughout the United States.
Investment in Dynegy Common Stock At December 31,
2006, the carrying value of the company’s investment in
Dynegy common stock was approximately $250 million.
This amount was about $180 million below the company’s
proportionate interest in Dynegy’s underlying net assets.
This difference is primarily the result of write-downs of the
investment in 2002 for declines in the market value of the
common shares below the company’s carrying value that were
deemed to be other than temporary. The difference had been
assigned to the extent practicable to specifi c Dynegy assets
and liabilities, based upon the company’s analysis of the vari-
ous factors associated with the decline in value of the Dynegy
shares. The company’s equity share of Dynegy’s reported
earnings is adjusted quarterly when appropriate to recognize
a portion of the difference between these allocated values
and Dynegy’s historical book values. The market value of the
company’s investment in Dynegy’s common stock at Decem-
ber 31, 2006, was approximately $700 million.
Investments in Dynegy Preferred Stock In May 2006,
the company’s investment in Dynegy Series C preferred
stock was redeemed at its face value of $400 million. Upon
redemption of the preferred stock, the company recorded a
before-tax gain of $130 million ($87 million after tax).
Dynegy Proposed Business Combination with LS Power
Group Dynegy and LS Power Group, a privately held power
plant investor, developer and manager, announced in Sep-
tember 2006 that the companies had executed a defi nitive
agreement to combine Dynegy’s assets and operations with
LS Power Group’s power-generation portfolio and for Dynegy
to acquire a 50 percent ownership interest in a development
joint venture with LS Power. Upon close of the transaction,
Chevron will receive the same number of shares of the new
company’s Class A common stock that it currently holds
in Dynegy. Chevron’s ownership interest in the combined
company will be approximately 11 percent. The transaction
is subject to specifi ed conditions, including the affi rmative
vote of two-thirds of Dynegy’s common shareholders and the
receipt of regulatory approvals.