Chevron 2006 Annual Report Download - page 89
Download and view the complete annual report
Please find page 89 of the 2006 Chevron annual report below. You can navigate through the pages in the report by either clicking on the pages listed below, or by using the keyword search tool below to find specific information within the annual report.-
 1
1 -
2
-
3
-
4
-
5
-
6
-
7
-
8
-
9
-
10
-
11
-
12
-
13
-
14
-
15
-
16
-
17
-
18
-
19
-
20
-
21
-
22
-
23
-
24
-
25
-
26
-
27
-
28
-
29
-
30
-
31
-
32
-
33
-
34
-
35
-
36
-
37
-
38
-
39
-
40
-
41
-
42
-
43
-
44
-
45
-
46
-
47
-
48
-
49
-
50
-
51
-
52
-
53
-
54
-
55
-
56
-
57
-
58
-
59
-
60
-
61
-
62
-
63
-
64
-
65
-
66
-
67
-
68
-
69
-
70
-
71
-
72
-
73
-
74
-
75
-
76
-
77
-
78
-
 79
79 -
 80
80 -
 81
81 -
 82
82 -
 83
83 -
 84
84 -
 85
85 -
 86
86 -
 87
87 -
 88
88 -
 89
89 -
 90
90 -
 91
91 -
 92
92 -
 93
93 -
 94
94 -
 95
95 -
 96
96 -
 97
97 -
 98
98 -
 99
99 -
100
-
101
-
102
-
103
-
104
-
105
-
106
-
107
-
108
 |
 |

CHEVRON CORPORATION 2006 ANNUAL REPORT 87
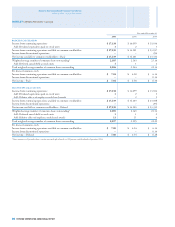
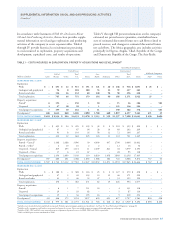
In accordance with Statement of FAS 69, Disclosures About
Oil and Gas Producing Activities, this section provides supple-
mental information on oil and gas exploration and producing
activities of the company in seven separate tables. Tables I
through IV provide historical cost information pertaining
to costs incurred in exploration, property acquisitions and
development; capitalized costs; and results of operations.
Tables V through VII present information on the company’s
estimated net proved reserve quantities, standardized mea-
sure of estimated discounted future net cash fl ows related to
proved reserves, and changes in estimated discounted future
net cash fl ows. The Africa geographic area includes activities
principally in Nigeria, Angola, Chad, Republic of the Congo
and Democratic Republic of the Congo. The Asia-Pacifi c
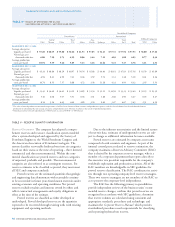
TABLE I – COSTS INCURRED IN EXPLORATION, PROPERTY ACQUISITIONS AND DEVELOPMENT1
Consolidated Companies
United States International
Gulf of Total A sia- Tota l Affi liated Companies
Millions of dollars Calif. Mexico Other U.S. Africa Pacifi c Indonesia Other Int’l. Total TCO Other
YEAR ENDED DEC. 31, 2006
Exploration
Wells $ – $ 493 $ 22 $ 515 $ 151 $ 121 $ 20 $ 246 $ 538 $ 1,053 $ 25 $ –
Geological and geophysical – 96 8 104 180 53 12 92 337 441 – –
Rentals and other – 116 16 132 48 140 58 50 296 428 – –
Total exploration – 705 46 751 379 314 90 388 1,171 1,922 25 –
Property acquisitions
Proved2 6 152 – 158 1 10 – 15 26 184 – 581
Unproved 1 47 10 58 – 1 – 135 136 194 – –
Total property acquisitions 7 199 10 216 1 11 – 150 162 378 – 581
Development3 686 1,632 868 3,186 2,890 1,788 460 1,019 6,157 9,343 671 25
TOTAL COSTS INCURRED $ 693 $ 2,536 $ 924 $ 4,153 $ 3,270 $ 2,113 $ 550 $ 1,557 $ 7,490 $ 11,643 $ 696 $ 606
YEAR ENDED DEC. 31, 20054
Exploration
Wells $ – $ 452 $ 24 $ 476 $ 105 $ 38 $ 9 $ 201 $ 353 $ 829 $ – $ –
Geological and geophysical – 67 – 67 96 28 10 68 202 269 – –
Rentals and other – 93 8 101 24 58 12 72 166 267 – –
Total exploration – 612 32 644 225 124 31 341 721 1,365 – –
Property acquisitions
Proved – Unocal2 – 1,608 2,388 3,996 30 6,609 637 1,790 9,066 13,062 – –
Proved – Other2 – 6 10 16 2 2 – 12 16 32 – –
Unproved – Unocal – 819 295 1,114 11 2,209 821 38 3,079 4,193 – –
Unproved – Other – 17 6 23 67 – – 28 95 118 – –
Total property acquisitions – 2,450 2,699 5,149 110 8,820 1,458 1,868 12,256 17,405 – –
Development3 507 680 601 1,788 1,892 1,088 382 726 4,088 5,876 767 43
TOTAL COSTS INCURRED $ 507 $ 3,742 $ 3,332 $ 7,581 $ 2,227 $ 10,032 $ 1,871 $ 2,935 $ 17,065 $ 24,646 $ 767 $ 43
YEAR ENDED DEC. 31, 20044
Exploration
Wells $ – $ 388 $ – $ 388 $ 116 $ 25 $ 2 $ 127 $ 270 $ 658 $ – $ –
Geological and geophysical – 47 2 49 103 10 12 46 171 220 – –
Rentals and other – 43 3 46 52 47 1 53 153 199 – –
Total exploration – 478 5 483 271 82 15 226 594 1,077 – –
Property acquisitions
Proved2 – 6 1 7 111 16 – 4 131 138 – –
Unproved – 29 – 29 82 – – 5 87 116 – –
Total property acquisitions – 35 1 36 193 16 – 9 218 254 – –
Development3 413 466 375 1,254 1,057 620 403 627 2,707 3,961 896 208
TOTAL COSTS INCURRED $ 413 $ 979 $ 381 $ 1,773 $ 1,521 $ 718 $ 418 $ 862 $ 3,519 $ 5,292 $ 896 $ 208
1 Includes costs incurred whether capitalized or expensed. Excludes general support equipment expenditures. See Note 24, “Asset Retirement Obligations,” on page 82.
2 Includes wells, equipment and facilities associated with proved reserves. Does not include properties acquired through property exchanges.
3 Includes $160, $160 and $63 costs incurred prior to assignment of proved reserves in 2006, 2005 and 2004, respectively.
4 2005 and 2004 presentation conformed to 2006.
SUPPLEMENTAL INFORMATION ON OIL AND GAS PRODUCING ACTIVITIES
Unaudited