Chevron 2006 Annual Report Download - page 77
Download and view the complete annual report
Please find page 77 of the 2006 Chevron annual report below. You can navigate through the pages in the report by either clicking on the pages listed below, or by using the keyword search tool below to find specific information within the annual report.-
 1
1 -
2
-
3
-
4
-
5
-
6
-
7
-
8
-
9
-
10
-
11
-
12
-
13
-
14
-
15
-
16
-
17
-
18
-
19
-
20
-
21
-
22
-
23
-
24
-
25
-
26
-
27
-
28
-
29
-
30
-
31
-
32
-
33
-
34
-
35
-
36
-
37
-
38
-
39
-
40
-
41
-
42
-
43
-
44
-
45
-
46
-
47
-
48
-
49
-
50
-
51
-
52
-
53
-
54
-
55
-
56
-
57
-
58
-
59
-
60
-
61
-
62
-
63
-
64
-
65
-
66
-
 67
67 -
 68
68 -
 69
69 -
 70
70 -
 71
71 -
 72
72 -
 73
73 -
 74
74 -
 75
75 -
 76
76 -
 77
77 -
 78
78 -
 79
79 -
 80
80 -
 81
81 -
 82
82 -
 83
83 -
 84
84 -
 85
85 -
 86
86 -
 87
87 -
88
-
89
-
90
-
91
-
92
-
93
-
94
-
95
-
96
-
97
-
98
-
99
-
100
-
101
-
102
-
103
-
104
-
105
-
106
-
107
-
108
 |
 |

CHEVRON CORPORATION 2006 ANNUAL REPORT 75CHEVRON CORPORATION 2006 ANNUAL REPORT 75
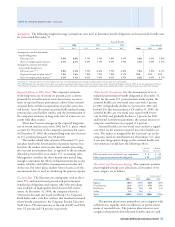
Assumptions The following weighted-average assumptions were used to determine benefi t obligations and net periodic benefi t costs
for years ended December 31:
Pension Benefi ts
2006 2005 2004 Other Benefi ts
U.S. Int’l. U.S. Int’l. U.S. Int’l. 2006 2005 2004
Assumptions used to determine
benefi t obligations
Discount rate
5.8% 6.0% 5.5% 5.9% 5.8% 6.4% 5.8% 5.6% 5.8%
Rate of compensation increase 4.5% 6.1% 4.0% 5.1% 4.0% 4.9% 4.5% 4.0% 4.1%
Assumptions used to determine
net periodic benefi t cost
Discount rate1,2,3 5.8% 5.9% 5.5% 6.4% 5.9% 6.8% 5.9% 5.8% 6.1%
Expected return on plan assets1,2 7.8% 7.4% 7.8% 7.9% 7.8% 8.3% N/A N/A N/A
Rate of compensation increase2 4.2% 5.1% 4.0% 5.0% 4.0% 4.9% 4.2% 4.0% 4.1%
1 Discount rate and expected rate of return on plan assets were reviewed and updated as needed on a quarterly basis for the main U.S. pension plan.
2 The 2005 discount rate, expected return on plan assets and rate of compensation increase refl ect the remeasurement of the Unocal benefi t plans at July 31, 2005, due to the acquisition of Unocal.
3 The 2006 U.S. discount rate refl ects remeasurement on July 1, 2006, due to plan combinations and changes, primarily merging benefi ts under several Unocal plans into related Chevron plans.
NOTE 21. EMPLOYEE BENEFIT PLANS – Continued
Expected Return on Plan Assets The company’s estimates
of the long-term rate of return on pension assets is driven
primarily by actual historical asset-class returns, an assess-
ment of expected future performance, advice from external
actuarial fi rms and the incorporation of specifi c asset-class
risk factors. Asset allocations are periodically updated using
pension plan asset/liability studies, and the determination of
the company’s estimates of long-term rates of return are con-
sistent with these studies.
There have been no changes in the expected long-term
rate of return on plan assets since 2002 for U.S. plans, which
account for 70 percent of the company’s pension plan assets.
At December 31, 2006, the estimated long-term rate of return
on U.S. pension plan assets was 7.8 percent.
The market-related value of assets of the major U.S. pen-
sion plan used in the determination of pension expense was
based on the market values in the three months preceding
the year-end measurement date, as opposed to the maximum
allowable period of fi ve years under U.S. accounting rules.
Management considers the three-month time period long
enough to minimize the effects of distortions from day-to-day
market volatility and still be contemporaneous to the end
of the year. For other plans, market value of assets as of the
measurement date is used in calculating the pension expense.
Discount Rate The discount rate assumptions used to deter-
mine U.S. and international pension and postretirement
benefi t plan obligations and expense refl ect the prevailing
rates available on high-quality, fi xed-income debt instru-
ments. At December 31, 2006, the company selected a
5.8 percent discount rate based on Moody’s Aa Corporate
Bond Index and a cash fl ow analysis that matched estimated
future benefi t payments to the Citigroup Pension Discount
Yield Curve. The discount rates at the end of 2005 and 2004
were 5.5 percent and 5.8 percent, respectively.
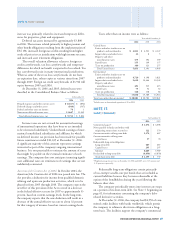
Other Benefi t Assumptions For the measurement of accu-
mulated postretirement benefi t obligation at December 31,
2006, for the main U.S. postretirement medical plan, the
assumed health care cost-trend rates start with 9 percent
in 2007 and gradually decline to 5 percent for 2011 and
beyond. For this measurement at December 31, 2005, the
assumed health care cost-trend rates started with 10 per-
cent in 2006 and gradually decline to 5 percent for 2011
and beyond. In both measurements, the annual increase to
company contributions was capped at 4 percent.
Assumed health care cost-trend rates can have a signifi -
cant effect on the amounts reported for retiree health care
costs. The impact is mitigated by the 4 percent cap on the
company’s medical contributions for the primary U.S. plan.
A one-percentage-point change in the assumed health care
cost-trend rates would have the following effects:
1 Percent 1 Percent
Increase Decrease
Effect on total service and interest cost components $ 8 $ (8)
Effect on postretirement benefi t obligation $ 89 $ (85)
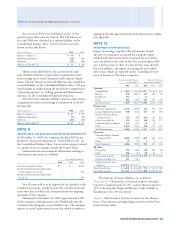
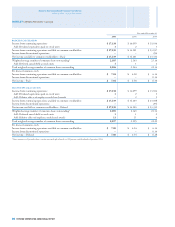
Plan Assets and Investment Strategy The company’s pension
plan weighted-average asset allocations at December 31 by
asset category are as follows:
U.S. International
Asset Category 2006 2005 2006 2005
Equities 68% 69%
62% 60%
Fixed Income 21% 21% 37% 39%
Real Estate 10% 9% 1% 1%
Other 1% 1% – –
Total 100% 100% 100% 100%
The pension plans invest primarily in asset categories with
suffi cient size, liquidity and cost effi ciency to permit invest-
ments of reasonable size. The pension plans invest in asset
categories that provide diversifi cation benefi ts and are easily