Chevron 2006 Annual Report Download - page 86
Download and view the complete annual report
Please find page 86 of the 2006 Chevron annual report below. You can navigate through the pages in the report by either clicking on the pages listed below, or by using the keyword search tool below to find specific information within the annual report.-
 1
1 -
2
-
3
-
4
-
5
-
6
-
7
-
8
-
9
-
10
-
11
-
12
-
13
-
14
-
15
-
16
-
17
-
18
-
19
-
20
-
21
-
22
-
23
-
24
-
25
-
26
-
27
-
28
-
29
-
30
-
31
-
32
-
33
-
34
-
35
-
36
-
37
-
38
-
39
-
40
-
41
-
42
-
43
-
44
-
45
-
46
-
47
-
48
-
49
-
50
-
51
-
52
-
53
-
54
-
55
-
56
-
57
-
58
-
59
-
60
-
61
-
62
-
63
-
64
-
65
-
66
-
67
-
68
-
69
-
70
-
71
-
72
-
73
-
74
-
75
-
 76
76 -
 77
77 -
 78
78 -
 79
79 -
 80
80 -
 81
81 -
 82
82 -
 83
83 -
 84
84 -
 85
85 -
 86
86 -
 87
87 -
 88
88 -
 89
89 -
 90
90 -
 91
91 -
 92
92 -
 93
93 -
 94
94 -
 95
95 -
 96
96 -
97
-
98
-
99
-
100
-
101
-
102
-
103
-
104
-
105
-
106
-
107
-
108
 |
 |

84 CHEVRON CORPORATION 2006 ANNUAL REPORT84 CHEVRON CORPORATION 2006 ANNUAL REPORT
Notes to the Consolidated Financial Statements
Millions of dollars, except per-share amounts
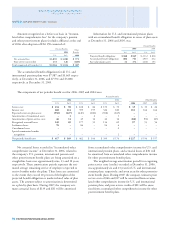
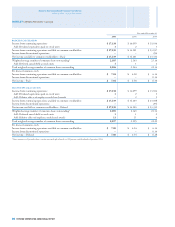
NOTE 27. EARNINGS PER SHARE – Continued
Year ended December 31
2006 2005 2004
BASIC EPS CALCULATION
Income from continuing operations $ 17,138 $ 14,099 $ 13,034
Add: Dividend equivalents paid on stock units 1 2 3
Income from continuing operations available to common stockholders $ 17,139 $ 14,101 $ 13,037
Income from discontinued operations – – 294
Net income available to common stockholders – Basic $ 17,139 $ 14,101 $ 13,331
Weighted-average number of common shares outstanding* 2,185 2,143 2,114
Add: Deferred awards held as stock units 1 1 2
Total weighted-average number of common shares outstanding 2,186 2,144 2,116
Per share of common stock
Income from continuing operations available to common stockholders $ 7.84 $ 6.58 $ 6.16
Income from discontinued operations – – 0.14
Net income – Basic $ 7.84 $ 6.58 $ 6.30
DILUTED EPS CALCULATION
Income from continuing operations $ 17,138 $ 14,099 $ 13,034
Add: Dividend equivalents paid on stock units 1 2 3
Add: Dilutive effects of employee stock-based awards – 2 1
Income from continuing operations available to common stockholders $ 17,139 $ 14,103 $ 13,038
Income from discontinued operations – – 294
Net income available to common stockholders – Diluted $ 17,139 $ 14,103 $ 13,332
Weighted-average number of common shares outstanding* 2,185 2,143 2,114
Add: Deferred awards held as stock units 1 1 2
Add: Dilutive effect of employee stock-based awards 11 11 6
Total weighted-average number of common shares outstanding 2,197 2,155 2,122
Per share of common stock
Income from continuing operations available to common stockholders $ 7.80 $ 6.54 $ 6.14
Income from discontinued operations – – 0.14
Net income – Diluted $ 7.80 $ 6.54 $ 6.28
*Share amounts in all periods refl ect a two-for-one stock split effected as a 100 percent stock dividend in September 2004.