Chevron 2006 Annual Report Download - page 34
Download and view the complete annual report
Please find page 34 of the 2006 Chevron annual report below. You can navigate through the pages in the report by either clicking on the pages listed below, or by using the keyword search tool below to find specific information within the annual report.-
 1
1 -
2
-
3
-
4
-
5
-
6
-
7
-
8
-
9
-
10
-
11
-
12
-
13
-
14
-
15
-
16
-
17
-
18
-
19
-
20
-
21
-
22
-
23
-
 24
24 -
 25
25 -
 26
26 -
 27
27 -
 28
28 -
 29
29 -
 30
30 -
 31
31 -
 32
32 -
 33
33 -
 34
34 -
 35
35 -
 36
36 -
 37
37 -
 38
38 -
 39
39 -
 40
40 -
 41
41 -
 42
42 -
 43
43 -
 44
44 -
45
-
46
-
47
-
48
-
49
-
50
-
51
-
52
-
53
-
54
-
55
-
56
-
57
-
58
-
59
-
60
-
61
-
62
-
63
-
64
-
65
-
66
-
67
-
68
-
69
-
70
-
71
-
72
-
73
-
74
-
75
-
76
-
77
-
78
-
79
-
80
-
81
-
82
-
83
-
84
-
85
-
86
-
87
-
88
-
89
-
90
-
91
-
92
-
93
-
94
-
95
-
96
-
97
-
98
-
99
-
100
-
101
-
102
-
103
-
104
-
105
-
106
-
107
-
108
 |
 |

MANAGEMENT’S DISCUSSION AND ANALYSIS OF
FINANCIAL CONDITION AND RESULTS OF OPERATIONS
32 CHEVRON CORPORATION 2006 ANNUAL REPORT
Refer to the “Selected Operating Data” table, on page
35, for the three-year comparative of international produc-
tion volumes.
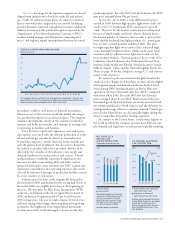
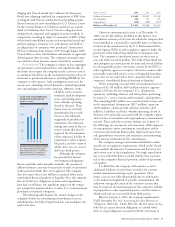
U.S. Downstream – Refining, Marketing and Transportation
Millions of dollars 2006 2005 2004
Income $ 1,938 $ 980 $ 1,261
U.S. downstream earnings of $1.9 billion in 2006
increased about $1 billion from 2005 and approximately
$700 million from 2004. Average refi ned-product margins
in 2006 were higher than in 2005, which in turn were also
higher than in 2004. Refi nery crude inputs were higher in
2006 than in the other comparative periods and also ben-
efi ted earnings. However, earnings declined in 2005 from
a year earlier due mainly to increased downtime at the
company’s refi neries, including the shutdown of operations at
Pascagoula, Mississippi, for more than a month due to hur-
ricanes in the Gulf of Mexico. The company’s marketing and
pipeline operations along the Gulf Coast were also disrupted
for an extended period due to the hurricanes. Fuel costs were
also higher in 2005 than in 2004.
Sales volumes of refi ned products in 2006 were approxi-
mately 1.5 million barrels per day, an increase of 1 percent
from 2005 and relatively unchanged from 2004. The
reported sales volume for 2006 was on a different basis than
in 2005 and 2004 due to a change in accounting rules that
became effective April 1, 2006, for certain purchase and sale
(buy/sell) contracts with the same counterparty. Excluding
the impact of the accounting change, refi ned product sales
in 2006 increased by approximately 6 percent and 3 percent
from 2005 and 2004, respectively. Branded gasoline sales
volumes of approximately 614,000 barrels per day in 2006
increased about 4 percent from 2005, largely due to the
growth of the Texaco brand. In 2005, refi ned-product sales
volumes decreased about 2 percent from 2004, primarily due
to disruption related to the hurricanes.
Refer to the “Selected Operating Data” table, on
page 35, for the three-year comparative refi ned-product
sales volumes in the United States. Refer also to Note 14,
“Accounting for Buy/Sell Contracts,” on page 67 for a discus-
sion of the accounting for purchase and sale contracts with
the same counterparty.
International Downstream – Refining, Marketing and Transportation
Millions of dollars 2006 2005 2004
Income* $ 2,035 $ 1,786 $ 1,989
*Includes Foreign Currency Effects: $ 98 $ (24) $ 7
International downstream income of $2 billion in 2006
increased about $250 million from 2005 and about $50
million from 2004. The
increase in 2006 from 2005
was associated mainly with
the benefi t of higher-refi ned
product margins in Asia-
Pacifi c and Canada and
improved results from
crude-oil and refi ned-
product trading activities.
The decrease in earnings
in 2005 from 2004 was
due mainly to lower sales
volumes; higher costs for fuel
and transportation; expenses
associated with a fi re at a 40
percent-owned, nonoperated
terminal in the United King-
dom; and tax adjustments in
various countries. These
items more than offset an
improvement in average
refi ned-product margins
between periods. Foreign
currency effects improved
income by $98 million
and $7 million in 2006
'
)/''
)(''
(+''
.''
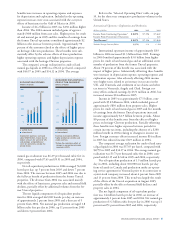
@EK<IE8K@FE8C>8JFC@E<
FK?<II<=@E<;GIF;L:KJ
J8C<J!
K_fljXe[jf]YXii\cjg\i[Xp
JXc\jmfcld\jf]i\]`e\[gif[lZkj
[\Zi\Xj\[XYflk-g\iZ\ek]ifd
)'',%<oZcl[`e^k_\\]]\Zkjf]Xe
XZZflek`e^Z_Xe^\]fiYlp&j\cc
ZfekiXZkj#jXc\jmfcld\j[\Zi\Xj\[
XYflk(g\iZ\ek%
!@eZcl[\j\hl`kp`eX]Ôc`Xk\j
>Xjfc`e\
A\k=l\c
>XjF`cjB\ifj\e\
I\j`[lXc=l\cF`c
Fk_\i
'*') '+ ', '-
)#().
'
(/''
(,''
()''
0''
-''
*''
L%J%>8JFC@E<
FK?<II<=@E<;
GIF;L:KJJ8C<J!
K_fljXe[jf]YXii\cjg\i[Xp
>Xjfc`e\
A\k=l\c
>XjF`cjB\ifj\e\
I\j`[lXc=l\cF`c
Fk_\i
I\Ôe\[gif[lZkjjXc\jmfcld\j
`eZi\Xj\[XYflk(g\iZ\ek]ifd
)'',#n`k__`^_\ijXc\jf]^Xjf`cj
Xe[]l\cf`cj%<oZcl[`e^k_\\]]\Zk
f]XeXZZflek`e^Z_Xe^\]fiYlp&
j\ccZfekiXZkj#jXc\jmfcld\j
`eZi\Xj\[XYflk-g\iZ\ek%
!@eZcl[\j\hl`kp`eX]Ôc`Xk\j
(#+0+
'*') '+ ', '-
$'%,
+%,
+%'
*%,
*%'
)%,
'%'
'%,
)%'
(%'
(%,
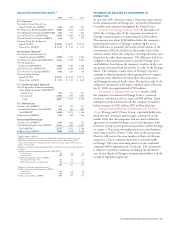
;fnejki\Xd\Xie`e^j`eZi\Xj\[
++g\iZ\ekdX`ecp[l\kf_`^_\i
dXi^`ejXe[i\]`e\iplk`c`qXk`fe%
Le`k\[JkXk\j
@ek\ieXk`feXc
NFIC;N@;<I<=@E@E>#
D8IB<K@E>
KI8EJGFIK8K@FE<8IE@E>J
9`cc`fejf][fccXij
'*') '+ ', '-
+%'