Chevron 2006 Annual Report Download - page 66
Download and view the complete annual report
Please find page 66 of the 2006 Chevron annual report below. You can navigate through the pages in the report by either clicking on the pages listed below, or by using the keyword search tool below to find specific information within the annual report.-
 1
1 -
2
-
3
-
4
-
5
-
6
-
7
-
8
-
9
-
10
-
11
-
12
-
13
-
14
-
15
-
16
-
17
-
18
-
19
-
20
-
21
-
22
-
23
-
24
-
25
-
26
-
27
-
28
-
29
-
30
-
31
-
32
-
33
-
34
-
35
-
36
-
37
-
38
-
39
-
40
-
41
-
42
-
43
-
44
-
45
-
46
-
47
-
48
-
49
-
50
-
51
-
52
-
53
-
54
-
55
-
 56
56 -
 57
57 -
 58
58 -
 59
59 -
 60
60 -
 61
61 -
 62
62 -
 63
63 -
 64
64 -
 65
65 -
 66
66 -
 67
67 -
 68
68 -
 69
69 -
 70
70 -
 71
71 -
 72
72 -
 73
73 -
 74
74 -
 75
75 -
 76
76 -
77
-
78
-
79
-
80
-
81
-
82
-
83
-
84
-
85
-
86
-
87
-
88
-
89
-
90
-
91
-
92
-
93
-
94
-
95
-
96
-
97
-
98
-
99
-
100
-
101
-
102
-
103
-
104
-
105
-
106
-
107
-
108
 |
 |

64 CHEVRON CORPORATION 2006 ANNUAL REPORT64 CHEVRON CORPORATION 2006 ANNUAL REPORT
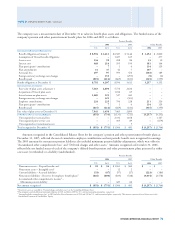
Segment Income Taxes Segment income tax expenses for the
years 2006, 2005 and 2004 are as follows:
Year ended December 31
2006 2005 2004
Upstream
United States $ 2,668 $ 2,330 $ 2,308
International 10,987 8,440 5,041
Total Upstream 13,655 10,770 7,349
Downstream
United States 1,162 575 739
International 586 576 442
Total Downstream 1,748 1,151 1,181
Chemicals
United States 213 99 47
International 30 25 17
Total Chemicals 243 124 64
All Other (808) (947) (1,077)
Income Tax Expense From
Continuing Operations* $ 14,838 $ 11,098 $ 7,517
*Income tax expense of $100 related to discontinued operations for 2004 is not included.
Other Segment Information Additional information for the
segmentation of major equity affiliates is contained in Note
12, beginning on page 65. Information related to properties,
plant and equipment by segment is contained in Note 13, on
page 67.
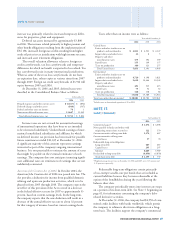
NOTE 9.
LEASE COMMITMENTS
Certain noncancelable leases are classifi ed as capital leases,
and the leased assets are included as part of “Properties, plant
and equipment, at cost.” Such leasing arrangements involve
tanker charters, crude oil production and processing equip-
ment, service stations, and other facilities. Other leases are
classifi ed as operating leases and are not capitalized. The
payments on such leases are recorded as expense. Details of
the capitalized leased assets are as follows:
At December 31
2006 2005
Upstream $ 461
$ 442
Downstream 896 837
Total 1,357 1,279
Less: Accumulated amortization 813 745
Net capitalized leased assets $ 544 $ 534
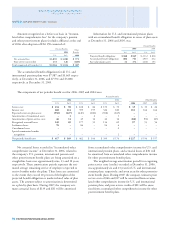
Rental expenses incurred for operating leases during
2006, 2005 and 2004 were as follows:
Year ended December 31
2006 2005 2004
Minimum rentals $ 2,326 $ 2,102 $ 2,093
Contingent rentals 6 6 7
Tota l 2,332 2,108 2,100
Less: Sublease rental income 33 43 40
Net rental expense $ 2,299 $ 2,065 $ 2,060
Contingent rentals are based on factors other than the
passage of time, principally sales volumes at leased service
stations. Certain leases include escalation clauses for adjusting
rentals to refl ect changes in price indices, renewal options
ranging up to 25 years, and options to purchase the leased
property during or at the end of the initial or renewal lease
period for the fair market value or other specifi ed amount at
that time.
At December 31, 2006, the estimated future minimum
lease payments (net of noncancelable sublease rentals) under
operating and capital leases, which at inception had a non-
cancelable term of more than one year, were as follows:
At December 31
Operating Capital
Leases Leases
Year: 2007 $ 509 $ 91
2008 507 80
2009 477 81
2010 390 59
2011 311 57
Thereafter 864 520
Total $ 3,058 $ 888
Less: Amounts representing interest
and executory costs (262)
Net present values 626
Less: Capital lease obligations
included in short-term debt (352)
Long-term capital lease obligations $ 274
NOTE 10.
RESTRUCTURING AND REORGANIZATION COSTS
In connection with the Unocal acquisition, the company imple-
mented a restructuring and reorganization program as part of
the effort to capture the synergies of the combined companies
by eliminating redundant operations, consolidating offi ces and
facilities, and sharing common services and functions.
As part of the restructuring and reorganization, approxi-
mately 600 employees were eligible for severance payments.
Most of the associated positions are in the United States and
relate primarily to corporate and upstream executive and
administrative functions. By year-end 2006, the program
was substantially complete.
NOTE 8. OPERATING SEGMENTS AND GEOGRAPHIC DATA – Continued
Notes to the Consolidated Financial Statements
Millions of dollars, except per-share amounts