Chevron 2006 Annual Report Download - page 67
Download and view the complete annual report
Please find page 67 of the 2006 Chevron annual report below. You can navigate through the pages in the report by either clicking on the pages listed below, or by using the keyword search tool below to find specific information within the annual report.-
 1
1 -
2
-
3
-
4
-
5
-
6
-
7
-
8
-
9
-
10
-
11
-
12
-
13
-
14
-
15
-
16
-
17
-
18
-
19
-
20
-
21
-
22
-
23
-
24
-
25
-
26
-
27
-
28
-
29
-
30
-
31
-
32
-
33
-
34
-
35
-
36
-
37
-
38
-
39
-
40
-
41
-
42
-
43
-
44
-
45
-
46
-
47
-
48
-
49
-
50
-
51
-
52
-
53
-
54
-
55
-
56
-
 57
57 -
 58
58 -
 59
59 -
 60
60 -
 61
61 -
 62
62 -
 63
63 -
 64
64 -
 65
65 -
 66
66 -
 67
67 -
 68
68 -
 69
69 -
 70
70 -
 71
71 -
 72
72 -
 73
73 -
 74
74 -
 75
75 -
 76
76 -
 77
77 -
78
-
79
-
80
-
81
-
82
-
83
-
84
-
85
-
86
-
87
-
88
-
89
-
90
-
91
-
92
-
93
-
94
-
95
-
96
-
97
-
98
-
99
-
100
-
101
-
102
-
103
-
104
-
105
-
106
-
107
-
108
 |
 |

CHEVRON CORPORATION 2006 ANNUAL REPORT 65CHEVRON CORPORATION 2006 ANNUAL REPORT 65
signing of the sales agreement and obtaining necessary regula-
tory approvals.
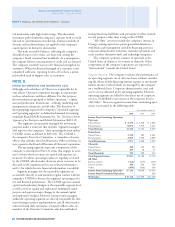
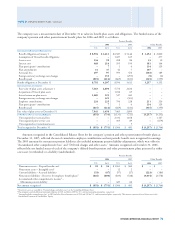
NOTE 12.
INVESTMENTS AND ADVANCES
Equity in earnings, together with investments in and
advances to companies accounted for using the equity
method and other investments accounted for at or below
cost, are shown in the table below. For certain equity affi li-
ates, Chevron pays its share of some income taxes directly.
For such affi liates, the equity in earnings do not include
these taxes, which are reported on the Consolidated State-
ment of Income as “Income tax expense.”
Investments and Advances Equity in Earnings
At December 31 Year ended December 31
2006 2005 2006 2005 2004
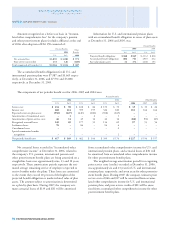
Upstream
Tengizchevroil $ 5,507 $ 5,007
$ 1,817 $ 1,514 $ 950
Hamaca 928 1,189 319 390 98
Petroboscan 712 – 31 – –
Other 682 679 123 139 148
Tota l Upstrea m 7,829 6,875 2,290 2,043 1,196
Downstream
GS Caltex Corporation 2,176 1,984 316 320 296
Caspian Pipeline Consortium 990 1,014 117 101 140
Star Petroleum Refi ning
Company Ltd. 787 709 116 81 207
Caltex Australia Ltd. 559 435 186 214 173
Colonial Pipeline Company 555 565 34 13 –
Other 1,839 1,562 358 273 143
Tota l Downst rea m 6,906 6,269 1,127 1,002 959
Chemicals
Chevron Phillips Chemical
Company LLC 2,044 1,908 697 449 334
Other 22 20 5 3 2
Total Chemicals 2,066 1,928 702 452 336
All Other
Dynegy Inc. 254 682 68 189 86
Other 586 740 68 45 5
Tot al equit y method $ 17,641 $ 16,494 $ 4,255 $ 3,731 $ 2,582
Other at or below cost 911 563
Total investments and
advances $ 18,552 $ 17,057
Total United States $ 4,191 $ 4,624 $ 955 $ 833 $ 588
Total International $ 14,361 $ 12,433 $ 3,300 $ 2,898 $ 1,994
Descriptions of major affiliates are as follows:
Tengizchevroil Chevron has a 50 percent equity ownership
interest in Tengizchevroil (TCO), a joint venture formed in
1993 to develop the Tengiz and Korolev crude oil fi elds in
Kazakhstan over a 40-year period.
Hamaca Chevron has a 30 percent interest in the Hamaca
heavy oil production and upgrading project located in Vene-
zuela’s Orinoco Belt.
An accrual of $106 was established as part of the
purchase-price allocation for Unocal. The $11 balance at
year-end 2006 was classifi ed as a current liability on the
Consolidated Balance Sheet. Activity for this accrual is
shown in the table below.
Amounts before tax 2006 2005
Balance at January 1 $ 44 $ –
Additions/adjustments (14) 106
Payments (19) (62)
Balance at December 31 $ 11 $ 44
Shown in the table below is the activity for the com-
pany’s liability related to various other reorganizations and
restructurings across several businesses and corporate depart-
ments. The $17 balance at year-end 2006 was also classifi ed as
a current liability on the Consolidated Balance Sheet. The asso-
ciated charges or credits during the periods were categorized as
“Operating expenses” or “Selling, general and administrative
expenses” on the Consolidated Statement of Income.
Activity for the company’s liability related to other various
reorganizations and restructurings is summarized in the fol-
lowing table:
Amounts before tax 2006 2005
Balance at January 1 $ 47 $ 119
Additions/adjustments (7) (10)
Payments (23) (62)
Balance at December 31 $ 17 $ 47
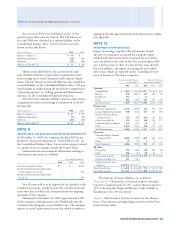
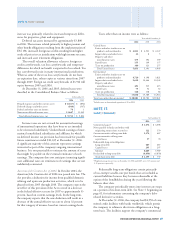
NOTE 11.
ASSETS HELD FOR SALE AND DISCONTINUED OPERATIONS
At December 31, 2004, the company classifi ed $162 of net
properties, plant and equipment as “Assets held for sale” on
the Consolidated Balance Sheet. Assets in this category related
to a group of service stations outside the United States.
Summarized income statement information relating to
discontinued operations is as follows:
Year ended December 31
2006 2005 2004
Revenues and other income $ – $ – $ 635
Income from discontinued operations
before income tax expense – – 394
Income from discontinued operations,
net of tax – – 294
Not all assets sold or to be disposed of are classifi ed as dis-
continued operations, mainly because the cash fl ows from the
assets were not, or will not be, eliminated from the ongoing
operations of the company.
Subsequent to December 31, 2006, approximately $300
of the company’s refi ning assets in the Netherlands met the
criteria for classifying the assets as held for sale. The company
expects to record a gain upon close of sale, which is subject to
NOTE 10. RESTRUCTURING AND REORGANIZATION COSTS – Continued