Chevron 2006 Annual Report Download - page 101
Download and view the complete annual report
Please find page 101 of the 2006 Chevron annual report below. You can navigate through the pages in the report by either clicking on the pages listed below, or by using the keyword search tool below to find specific information within the annual report.-
 1
1 -
2
-
3
-
4
-
5
-
6
-
7
-
8
-
9
-
10
-
11
-
12
-
13
-
14
-
15
-
16
-
17
-
18
-
19
-
20
-
21
-
22
-
23
-
24
-
25
-
26
-
27
-
28
-
29
-
30
-
31
-
32
-
33
-
34
-
35
-
36
-
37
-
38
-
39
-
40
-
41
-
42
-
43
-
44
-
45
-
46
-
47
-
48
-
49
-
50
-
51
-
52
-
53
-
54
-
55
-
56
-
57
-
58
-
59
-
60
-
61
-
62
-
63
-
64
-
65
-
66
-
67
-
68
-
69
-
70
-
71
-
72
-
73
-
74
-
75
-
76
-
77
-
78
-
79
-
80
-
81
-
82
-
83
-
84
-
85
-
86
-
87
-
88
-
89
-
90
-
 91
91 -
 92
92 -
 93
93 -
 94
94 -
 95
95 -
 96
96 -
 97
97 -
 98
98 -
 99
99 -
 100
100 -
 101
101 -
 102
102 -
 103
103 -
 104
104 -
 105
105 -
 106
106 -
 107
107 -
 108
108
 |
 |

CHEVRON CORPORATION 2006 ANNUAL REPORT 99
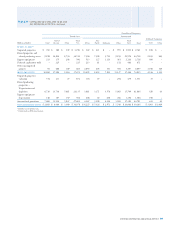
TABLE VI – STANDARDIZED MEASURE OF DISCOUNTED FUTURE NET CASH
FLOWS RELATED TO PROVED OIL AND GAS RESERVES – Continued
Consolidated Companies
United States International
Gulf of Total Asia- Total Affi liated Companies
Millions of dollars Calif. Mexico Other U.S. Africa Pacifi c Indonesia Other Int’l. Total TCO Other
AT DECEMBER 31, 2006
Future cash infl ows
from production $ 48,828 $ 23,768 $ 38,727 $ 111,323 $ 97,571 $ 70,288 $ 30,538 $ 36,272 $ 234,669 $ 345,992 $ 104,069 $ 20,644
Future production costs (14,791) (6,750) (12,845) (34,386) (12,523) (13,398) (16,281) (10,777) (52,979) (87,365) (7,796) (2,348)
Future devel. costs (3,999) (2,947) (1,399) (8,345) (9,648) (6,963) (2,284) (3,082) (21,977) (30,322) (7,026) (1,732)
Future income taxes (10,171) (4,764) (8,290) (23,225) (53,214) (20,633) (5,448) (11,164) (90,459) (113,684) (25,212) (8,282)
Undiscounted future
net cash fl ows 19,867 9,307 16,193 45,367 22,186 29,294 6,525 11,249 69,254 114,621 64,035 8,282
10 percent midyear annual
discount for timing of
estimated cash fl ows (9,779) (3,256) (7,210) (20,245) (10,065) (12,457) (2,426) (3,608) (28,556) (48,801) (40,597) (5,185)
STANDARDIZED MEASURE
NET CASH FLOWS $ 10,088 $ 6,051 $ 8,983 $ 25,122 $ 12,121 $ 16,837 $ 4,099 $ 7,641 $ 40,698 $ 65,820 $ 23,438 $ 3,097
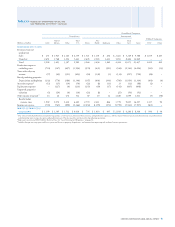
AT DECEMBER 31, 2005
Future cash infl ows
from production $ 50,771 $ 29,422 $ 50,039 $ 130,232 $ 101,912 $ 73,612 $ 32,538 $ 44,680 $ 252,742 $ 382,974 $ 97,707 $ 20,616
Future production costs (15,719) (5,758) (12,767) (34,244) (11,366) (12,459) (18,260) (11,908) (53,993) (88,237) (7,399) (2,101)
Future devel. costs (2,274) (2,467) (873) (5,614) (8,197) (5,840) (1,730) (2,439) (18,206) (23,820) (5,996) (762)
Future income taxes (11,092) (7,173) (12,317) (30,582) (50,894) (21,509) (5,709) (13,917) (92,029) (122,611) (23,818) (6,036)
Undiscounted future
net cash fl ows 21,686 14,024 24,082 59,792 31,455 33,804 6,839 16,416 88,514 148,306 60,494 11,717
10 percent midyear annual
discount for timing of
estimated cash fl ows (10,947) (4,520) (10,838) (26,305) (14,881) (14,929) (2,269) (5,635) (37,714) (64,019) (37,674) (7,768)
STANDARDIZED MEASURE
NET CASH FLOWS $ 10,739 $ 9,504 $ 13,244 $ 33,487 $ 16,574 $ 18,875 $ 4,570 $ 10,781 $ 50,800 $ 84,287 $ 22,820 $ 3,949
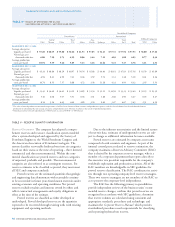
AT DECEMBER 31, 2004
Future cash infl ows
from production $ 32,793 $ 19,043 $ 28,676 $ 80,512 $ 64,628 $ 35,960 $ 25,313 $ 30,061 $ 155,962 $ 236,474 $ 61,875 $ 12,769
Future production costs (11,245) (3,840) (7,343) (22,428) (10,662) (8,604) (12,830) (7,884) (39,980) (62,408) (7,322) (3,734)
Future devel. costs (1,731) (2,389) (667) (4,787) (6,355) (2,531) (717) (1,593) (11,196) (15,983) (5,366) (407)
Future income taxes (6,706) (4,336) (6,991) (18,033) (29,519) (9,731) (5,354) (9,914) (54,518) (72,551) (13,895) (2,934)
Undiscounted future
net cash fl ows 13,111 8,478 13,675 35,264 18,092 15,094 6,412 10,670 50,268 85,532 35,292 5,694
10 percent midyear annual
discount for timing of
estimated cash fl ows (6,656) (2,715) (6,110) (15,481) (9,035) (6,966) (2,465) (3,451) (21,917) (37,398) (22,249) (3,817)
STANDARDIZED MEASURE
NET CASH FLOWS $ 6,455 $ 5,763 $ 7,565 $ 19,783 $ 9,057 $ 8,128 $ 3,947 $ 7,219 $ 28,351 $ 48,134 $ 13,043 $ 1,877