Chevron 2006 Annual Report Download - page 92
Download and view the complete annual report
Please find page 92 of the 2006 Chevron annual report below. You can navigate through the pages in the report by either clicking on the pages listed below, or by using the keyword search tool below to find specific information within the annual report.-
 1
1 -
2
-
3
-
4
-
5
-
6
-
7
-
8
-
9
-
10
-
11
-
12
-
13
-
14
-
15
-
16
-
17
-
18
-
19
-
20
-
21
-
22
-
23
-
24
-
25
-
26
-
27
-
28
-
29
-
30
-
31
-
32
-
33
-
34
-
35
-
36
-
37
-
38
-
39
-
40
-
41
-
42
-
43
-
44
-
45
-
46
-
47
-
48
-
49
-
50
-
51
-
52
-
53
-
54
-
55
-
56
-
57
-
58
-
59
-
60
-
61
-
62
-
63
-
64
-
65
-
66
-
67
-
68
-
69
-
70
-
71
-
72
-
73
-
74
-
75
-
76
-
77
-
78
-
79
-
80
-
81
-
 82
82 -
 83
83 -
 84
84 -
 85
85 -
 86
86 -
 87
87 -
 88
88 -
 89
89 -
 90
90 -
 91
91 -
 92
92 -
 93
93 -
 94
94 -
 95
95 -
 96
96 -
 97
97 -
 98
98 -
 99
99 -
 100
100 -
 101
101 -
 102
102 -
103
-
104
-
105
-
106
-
107
-
108
 |
 |

90 CHEVRON CORPORATION 2006 ANNUAL REPORT
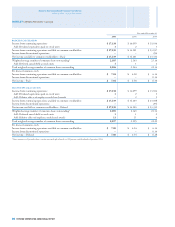
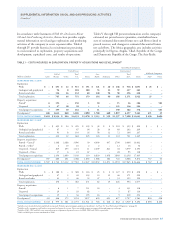
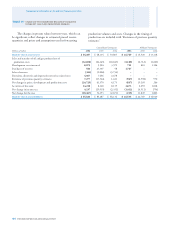
TABLE III – RESULTS OF OPERATIONS FOR OIL AND
GAS PRODUCING ACTIVITIES1
The company’s results of operations from oil and gas
producing activities for the years 2006, 2005 and 2004 are
shown in the following table. Net income from exploration
and production activities as reported on page 62 refl ects
income taxes computed on an effective rate basis.
In accordance with FAS 69, income taxes in Table III are
based on statutory tax rates, refl ecting allowable deductions
and tax credits. Interest income and expense are excluded
from the results reported in Table III and from the net
income amounts on page 62.
Consolidated Companies
United States International
Gulf of Total Asia- Total Affi liated Companies
Millions of dollars Calif. Mexico Other U.S. Africa Pacifi c Indonesia Other Int’l. Total TCO Other
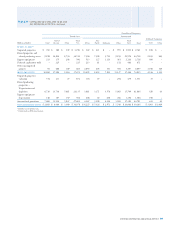
YEAR ENDED DEC. 31, 2006
Revenues from net
production
Sales $ 308 $ 1,845 $ 2,976 $ 5,129 $ 2,377 $ 4,938 $ 1,001 $ 2,814 $ 11,130 $ 16,259 $ 2,861 $ 598
Transfers 4,072 2,317 2,046 8,435 5,264 4,084 2,211 2,848 14,407 22,842 – –
Total 4,380 4,162 5,022 13,564 7,641 9,022 3,212 5,662 25,537 39,101 2,861 598
Production expenses
excluding taxes (889) (765) (1,057) (2,711) (640) (740) (728) (664) (2,772) (5,483) (202) (42)
Taxes other than on
income (84) (57) (442) (583) (57) (231) (1) (60) (349) (932) (28) (6)
Proved producing
properties: Depreciation
and depletion (275) (1,096) (763) (2,134) (579) (1,475) (666) (703) (3,423) (5,557) (114) (33)
Accretion expense2 (11) (80) (39) (130) (26) (30) (23) (49) (128) (258) (1) –
Exploration expenses – (407) (24) (431) (296) (209) (110) (318) (933) (1,364) (25) –
Unproved properties
valuation (3) (73) (8) (84) (28) (15) (14) (27) (84) (168) – –
Other income (expense)3 1 (732) 254 (477) (435) (475) 50 385 (475) (952) 8 (50)
Results before
income taxes 3,119 952 2,943 7,014 5,580 5,847 1,720 4,226 17,373 24,387 2,499 467
Income tax expense (1,169) (357) (1,103) (2,629) (4,740) (3,224) (793) (2,151) (10,908) (13,537) (750) (174)
RESULTS OF PRODUCING
OPERATIONS $ 1,950 $ 595 $ 1,840 $ 4,385 $ 840 $ 2,623 $ 927 $ 2,075 $ 6,465 $ 10,850 $ 1,749 $ 293
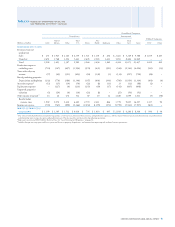
YEAR ENDED DEC. 31, 2005
Revenues from net
production
Sales $ 337 $ 1,576 $ 3,174 $ 5,087 $ 2,142 $ 2,941 $ 539 $ 2,668 $ 8,290 $ 13,377 $ 2,307 $ 666
Transfers 3,497 2,127 1,395 7,019 3,615 3,179 1,986 2,607 11,387 18,406 – –
Total 3,834 3,703 4,569 12,106 5,757 6,120 2,525 5,275 19,677 31,783 2,307 666
Production expenses
excluding taxes (916) (638) (777) (2,331) (558) (570) (660) (596) (2,384) (4,715) (152) (82)
Taxes other than on
income (65) (41) (384) (490) (48) (189) (1) (195) (433) (923) (27) –
Proved producing
properties: Depreciation
and depletion (253) (936) (520) (1,709) (414) (852) (550) (672) (2,488) (4,197) (83) (46)
Accretion expense2 (13) (35) (46) (94) (22) (20) (15) (25) (82) (176) (1) –
Exploration expenses – (307) (13) (320) (117) (90) (26) (190) (423) (743) – –
Unproved properties
valuation (3) (32) (4) (39) (50) (8) – (24) (82) (121) – –
Other income (expense)3 2 (354) (140) (492) (243) (182) 182 280 37 (455) (9) 8
Results before
income taxes 2,586 1,360 2,685 6,631 4,305 4,209 1,455 3,853 13,822 20,453 2,035 546
Income tax expense (913) (482) (953) (2,348) (3,430) (2,264) (644) (1,938) (8,276) (10,624) (611) (186)
RESULTS OF PRODUCING
OPERATIONS $ 1,673 $ 878 $ 1,732 $ 4,283 $ 875 $ 1,945 $ 811 $ 1,915 $ 5,546 $ 9,829 $ 1,424 $ 360
1 The value of owned production consumed in operations as fuel has been eliminated from revenues and production expenses, and the related volumes have been deducted from net production in
calculating the unit average sales price and production cost. This has no effect on the results of producing operations.
2 Represents accretion of ARO liability. Refer to Note 24, “Asset Retirement Obligations,” on page 82.
3 Includes foreign currency gains and losses, gains and losses on property dispositions, and income from operating and technical service agreements.
Supplemental Information on Oil and Gas Producing Activities