Chevron 2006 Annual Report Download - page 85
Download and view the complete annual report
Please find page 85 of the 2006 Chevron annual report below. You can navigate through the pages in the report by either clicking on the pages listed below, or by using the keyword search tool below to find specific information within the annual report.-
 1
1 -
2
-
3
-
4
-
5
-
6
-
7
-
8
-
9
-
10
-
11
-
12
-
13
-
14
-
15
-
16
-
17
-
18
-
19
-
20
-
21
-
22
-
23
-
24
-
25
-
26
-
27
-
28
-
29
-
30
-
31
-
32
-
33
-
34
-
35
-
36
-
37
-
38
-
39
-
40
-
41
-
42
-
43
-
44
-
45
-
46
-
47
-
48
-
49
-
50
-
51
-
52
-
53
-
54
-
55
-
56
-
57
-
58
-
59
-
60
-
61
-
62
-
63
-
64
-
65
-
66
-
67
-
68
-
69
-
70
-
71
-
72
-
73
-
74
-
 75
75 -
 76
76 -
 77
77 -
 78
78 -
 79
79 -
 80
80 -
 81
81 -
 82
82 -
 83
83 -
 84
84 -
 85
85 -
 86
86 -
 87
87 -
 88
88 -
 89
89 -
 90
90 -
 91
91 -
 92
92 -
 93
93 -
 94
94 -
 95
95 -
96
-
97
-
98
-
99
-
100
-
101
-
102
-
103
-
104
-
105
-
106
-
107
-
108
 |
 |

CHEVRON CORPORATION 2006 ANNUAL REPORT 83CHEVRON CORPORATION 2006 ANNUAL REPORT 83
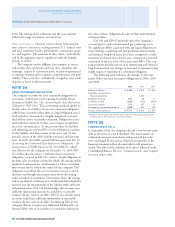
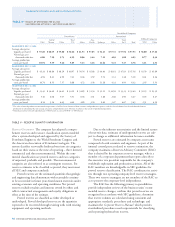
NOTE 26.
OTHER FINANCIAL INFORMATION
Net income in 2004 included gains of approximately $1,200
relating to the sale of nonstrategic upstream properties. Of
this amount, $257 related to assets classifi ed as discontinued
operations.
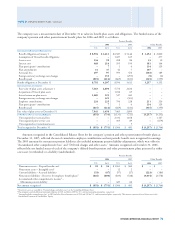
Other fi nancial information is as follows:
Year ended December 31
2006 2005 2004
Tota l fi nancing interest and debt costs $ 608 $ 542 $ 450
Less: Capitalized interest 157 60 44
Interest and debt expense $ 451 $ 482 $ 406
Research and development expenses $ 468 $ 316 $ 242
Foreign currency effects* $ (219) $ (61) $ (81)
* Includes $15, $(2) and $(13) in 2006, 2005 and 2004, respectively, for the company’s
share of equity affi liates’ foreign currency effects.
The excess of market value over the carrying value of
inventories for which the Last-In, First-Out (LIFO) method
is used was $6,010, $4,846 and $3,036 at December 31,
2006, 2005 and 2004, respectively. Market value is generally
based on average acquisition costs for the year. LIFO profi ts
of $82, $34 and $36 were included in net income for the
years 2006, 2005 and 2004, respectively.
NOTE 27.
EARNINGS PER SHARE
Basic earnings per share (EPS) is based upon net income
less preferred stock dividend requirements and includes
the effects of deferrals of salary and other compensation
awards that are invested in Chevron stock units by certain
offi cers and employees of the company and the company’s
share of stock transactions of affi liates, which, under the
applicable accounting rules, may be recorded directly to the
company’s retained earnings instead of net income. Diluted
EPS includes the effects of these items as well as the dilutive
effects of outstanding stock options awarded under the
company’s stock option programs (refer to Note 22, “Stock
Options and Other Share-Based Compensation” begin-
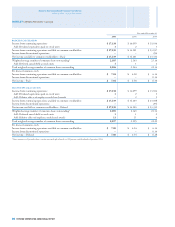
ning on page 77). The table on the following page sets forth
the computation of basic and diluted EPS: