Albertsons 2014 Annual Report Download - page 95
Download and view the complete annual report
Please find page 95 of the 2014 Albertsons annual report below. You can navigate through the pages in the report by either clicking on the pages listed below, or by using the keyword search tool below to find specific information within the annual report.-
 1
1 -
2
-
3
-
4
-
5
-
6
-
7
-
8
-
9
-
10
-
11
-
12
-
13
-
14
-
15
-
16
-
17
-
18
-
19
-
20
-
21
-
22
-
23
-
24
-
25
-
26
-
27
-
28
-
29
-
30
-
31
-
32
-
33
-
34
-
35
-
36
-
37
-
38
-
39
-
40
-
41
-
42
-
43
-
44
-
45
-
46
-
47
-
48
-
49
-
50
-
51
-
52
-
53
-
54
-
55
-
56
-
57
-
58
-
59
-
60
-
61
-
62
-
63
-
64
-
65
-
66
-
67
-
68
-
69
-
70
-
71
-
72
-
73
-
74
-
75
-
76
-
77
-
78
-
79
-
80
-
81
-
82
-
83
-
84
-
 85
85 -
 86
86 -
 87
87 -
 88
88 -
 89
89 -
 90
90 -
 91
91 -
 92
92 -
 93
93 -
 94
94 -
 95
95 -
 96
96 -
 97
97 -
 98
98 -
 99
99 -
 100
100 -
 101
101 -
 102
102 -
 103
103 -
 104
104 -
 105
105 -
106
-
107
-
108
-
109
-
110
-
111
-
112
-
113
-
114
-
115
-
116
-
117
-
118
-
119
-
120
-
121
-
122
-
123
-
124
-
125
-
126
-
127
-
128
-
129
-
130
-
131
-
132
-
133
-
134
-
135
-
136
-
137
-
138
-
139
-
140
-
141
-
142
-
143
-
144
 |
 |

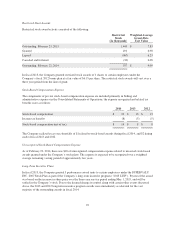
The grant date fair value used to determine compensation expense associated with the performance grant was
calculated utilizing a Monte Carlo simulation. The grant date fair value of the 2013 LTIP award was $1.38 per
award unit. The amount of the awards outstanding was insignificant as of February 22, 2014. The assumptions
related to the valuation of the Company’s 2013 LTIP consisted of the following:
2013
Dividend yield 4.1%
Volatility rate 45.8%
Risk-free interest rate 0.4%
Expected life 3.0 years
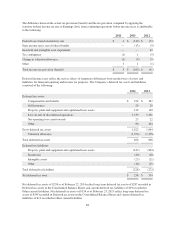
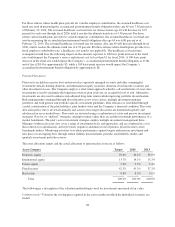
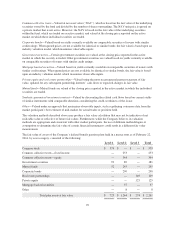
NOTE 10—NET EARNINGS (LOSS) PER SHARE
The following table reflects the calculation of basic and diluted net earnings (loss) per share:
2014 2013 2012
Net earnings (loss) per share—basic:
Net earnings (loss) from continuing operations available to
common stockholders $ 6 $ (263) $ (110)
Weighted average shares outstanding—basic 255 212 212
Net earnings (loss) from continuing operations per share—basic $ 0.02 $ (1.24) $ (0.52)
Income (loss) from discontinued operations, net of tax, available
to common stockholders $ 176 $ (1,203) $ (930)
Weighted average shares outstanding—basic 255 212 212
Net earnings (loss) from discontinued operations per share—basic $ 0.69 $ (5.67) $ (4.39)
Net earnings (loss) available to common stockholders $ 182 $ (1,466) $ (1,040)
Weighted average shares outstanding—basic 255 212 212
Net earnings (loss) per share—basic $ 0.71 $ (6.91) $ (4.91)
Net earnings (loss) per share—diluted:
Net earnings (loss) from continuing operations available to
common stockholders $ 6 $ (263) $ (110)
Weighted average shares outstanding—basic 255 212 212
Dilutive impact of stock-based awards 3 — —
Weighted average shares outstanding—diluted 258 212 212
Net earnings (loss) from continuing operations per share—diluted $ 0.02 $ (1.24) $ (0.52)
Income (loss) from discontinued operations, net of tax, available
to common stockholders $ 176 $ (1,203) $ (930)
Weighted average shares outstanding—basic 255 212 212
Dilutive impact of stock-based awards 3 — —
Weighted average shares outstanding—diluted 258 212 212
Net earnings (loss) from discontinued operations per share—diluted $ 0.68 $ (5.67) $ (4.39)
93