Albertsons 2014 Annual Report Download - page 68
Download and view the complete annual report
Please find page 68 of the 2014 Albertsons annual report below. You can navigate through the pages in the report by either clicking on the pages listed below, or by using the keyword search tool below to find specific information within the annual report.-
 1
1 -
2
-
3
-
4
-
5
-
6
-
7
-
8
-
9
-
10
-
11
-
12
-
13
-
14
-
15
-
16
-
17
-
18
-
19
-
20
-
21
-
22
-
23
-
24
-
25
-
26
-
27
-
28
-
29
-
30
-
31
-
32
-
33
-
34
-
35
-
36
-
37
-
38
-
39
-
40
-
41
-
42
-
43
-
44
-
45
-
46
-
47
-
48
-
49
-
50
-
51
-
52
-
53
-
54
-
55
-
56
-
57
-
 58
58 -
 59
59 -
 60
60 -
 61
61 -
 62
62 -
 63
63 -
 64
64 -
 65
65 -
 66
66 -
 67
67 -
 68
68 -
 69
69 -
 70
70 -
 71
71 -
 72
72 -
 73
73 -
 74
74 -
 75
75 -
 76
76 -
 77
77 -
 78
78 -
79
-
80
-
81
-
82
-
83
-
84
-
85
-
86
-
87
-
88
-
89
-
90
-
91
-
92
-
93
-
94
-
95
-
96
-
97
-
98
-
99
-
100
-
101
-
102
-
103
-
104
-
105
-
106
-
107
-
108
-
109
-
110
-
111
-
112
-
113
-
114
-
115
-
116
-
117
-
118
-
119
-
120
-
121
-
122
-
123
-
124
-
125
-
126
-
127
-
128
-
129
-
130
-
131
-
132
-
133
-
134
-
135
-
136
-
137
-
138
-
139
-
140
-
141
-
142
-
143
-
144
 |
 |

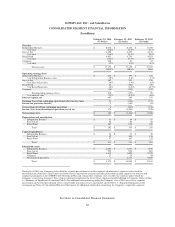
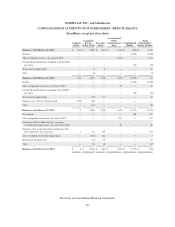
SUPERVALU INC. and Subsidiaries
CONSOLIDATED STATEMENTS OF STOCKHOLDERS’ (DEFICIT) EQUITY
(In millions, except per share data)
Common
Stock
Capital in
Excess
of Par Value
Treasury
Stock
Accumulated
Other
Comprehensive
Loss
Accumulated
Deficit
Total
Stockholders’
Equity (Deficit)
Balances as of February 26, 2011 $ 230 $ 2,855 $ (521) $ (446) $ (778) $ 1,340
Net loss — — — — (1,040) (1,040)
Other comprehensive loss, net of tax of $129 — — — (211) — (211)
Cash dividends declared on common stock $0.3500
per share — — — — (74) (74)
Stock-based compensation — 8 6 — — 14
Other — (8) — — — (8)
Balances as of February 25, 2012 230 2,855 (515) (657) (1,892) 21
Net loss — — — — (1,466) (1,466)
Other comprehensive income, net of tax of $22 — — — 45 — 45
Cash dividends declared on common stock $0.0875
per share — — — — (19) (19)
Stock-based compensation — (27) 41 — — 14
Change in par value of common stock (228) 228 — — — —
Other — (10) — — — (10)
Balances as of February 23, 2013 2 3,046 (474) (612) (3,377) (1,415)
Net earnings — — — — 182 182
Other comprehensive income, net of tax of $123 — — — 257 — 257
Divestiture of New Albertsons, Inc.’s pension
accumulated comprehensive loss, net of tax of $31 — — — 48 — 48
Common stock issued and sold in connection with
New Albertsons, Inc. divesture 1 12 157 — — 170
Sales of common stock under option plans — (134) 141 — — 7
Stock-based compensation — (54) 79 — — 25
Other — (8) (4) — — (12)
Balances as of February 22, 2014 $ 3 $ 2,862 $ (101) $ (307) $ (3,195) $ (738)
See Notes to Consolidated Financial Statements.
66