Albertsons 2014 Annual Report Download - page 111
Download and view the complete annual report
Please find page 111 of the 2014 Albertsons annual report below. You can navigate through the pages in the report by either clicking on the pages listed below, or by using the keyword search tool below to find specific information within the annual report.-
 1
1 -
2
-
3
-
4
-
5
-
6
-
7
-
8
-
9
-
10
-
11
-
12
-
13
-
14
-
15
-
16
-
17
-
18
-
19
-
20
-
21
-
22
-
23
-
24
-
25
-
26
-
27
-
28
-
29
-
30
-
31
-
32
-
33
-
34
-
35
-
36
-
37
-
38
-
39
-
40
-
41
-
42
-
43
-
44
-
45
-
46
-
47
-
48
-
49
-
50
-
51
-
52
-
53
-
54
-
55
-
56
-
57
-
58
-
59
-
60
-
61
-
62
-
63
-
64
-
65
-
66
-
67
-
68
-
69
-
70
-
71
-
72
-
73
-
74
-
75
-
76
-
77
-
78
-
79
-
80
-
81
-
82
-
83
-
84
-
85
-
86
-
87
-
88
-
89
-
90
-
91
-
92
-
93
-
94
-
95
-
96
-
97
-
98
-
99
-
100
-
 101
101 -
 102
102 -
 103
103 -
 104
104 -
 105
105 -
 106
106 -
 107
107 -
 108
108 -
 109
109 -
 110
110 -
 111
111 -
 112
112 -
 113
113 -
 114
114 -
 115
115 -
 116
116 -
 117
117 -
 118
118 -
 119
119 -
 120
120 -
 121
121 -
122
-
123
-
124
-
125
-
126
-
127
-
128
-
129
-
130
-
131
-
132
-
133
-
134
-
135
-
136
-
137
-
138
-
139
-
140
-
141
-
142
-
143
-
144
 |
 |

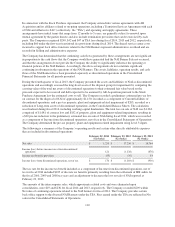
The Company offers a wide variety of nationally advertised brand name and private-label products, primarily
including grocery (both perishable and nonperishable), general merchandise and health and beauty care,
pharmacy and fuel, which are sold through the Company’s owned, licensed and franchised retail stores to
shoppers and through its Independent Business to independent retail customers. The amounts and percentages of
Net sales for each group of similar products sold in the Independent Business, Save-A-Lot and Retail Food
segments and Corporate revenue consisted of the following:
2014 2013 2012
Independent Business:
Nonperishable grocery products (1) $ 6,000 35% $ 6,140 36% $ 6,222 36%
Perishable grocery products (2) 1,951 11 1,935 11 1,880 11
Services to independent retail customers and other 85 1 91 1 92 —
8,036 47% 8,166 48% 8,194 47%
Save-A-Lot:
Nonperishable grocery products (1) $ 2,829 17% $ 2,865 17% $ 2,925 17%
Perishable grocery products (2) 1,399 8 1,330 8 1,296 7
4,228 25% 4,195 25% 4,221 24%
Retail Food:
Nonperishable grocery products (1) $ 2,600 15% $ 2,689 16% $ 2,820 17%
Perishable grocery products (2) 1,463 9 1,428 8 1,461 8
Pharmacy products 491 3 512 3 483 3
Fuel 67 — 77 — 126 1
Other 30 — 30 — 31 —
4,651 27% 4,736 27% 4,921 29%
Corporate:
Transition service revenue $ 240 1% $ 42 —% $ 47 —%
Net sales $ 17,155 100% $ 17,139 100% $ 17,383 100%
(1) Includes such items as dry goods, general merchandise, health and beauty care, beverages, dairy, frozen
foods, and candy
(2) Includes such items as meat, produce, deli and bakery
NOTE 14—DISCONTINUED OPERATIONS AND DIVESTITURES
Discontinued Operations
On March 21, 2013, the Company sold its Albertsons, Acme, Jewel-Osco, Shaw’s and Star Market banners and
related Osco and Sav-on in-store pharmacies (collectively, the “NAI Banners”) to AB Acquisition.
The Company received net proceeds of approximately $100 and a short-term note receivable of approximately
$44 for the stock of NAI. AB Acquisition assumed approximately $3,200 of debt and capital leases, excluding
original issue discounts. In addition, AB Acquisition assumed the underfunded status of NAI’s related share of
the multiemployer pension plans to which the Company contributed. AB Acquisition’s portion of the
underfunded status of the multiemployer pension plans was estimated to be approximately $1,138 before tax,
based on the Company’s estimated “proportionate share” of underfunding calculated as of February 23, 2013.
109