Albertsons 2014 Annual Report Download - page 12
Download and view the complete annual report
Please find page 12 of the 2014 Albertsons annual report below. You can navigate through the pages in the report by either clicking on the pages listed below, or by using the keyword search tool below to find specific information within the annual report.-
 1
1 -
 2
2 -
 3
3 -
 4
4 -
 5
5 -
 6
6 -
 7
7 -
 8
8 -
 9
9 -
 10
10 -
 11
11 -
 12
12 -
 13
13 -
 14
14 -
 15
15 -
 16
16 -
 17
17 -
 18
18 -
 19
19 -
 20
20 -
 21
21 -
 22
22 -
23
-
24
-
25
-
26
-
27
-
28
-
29
-
30
-
31
-
32
-
33
-
34
-
35
-
36
-
37
-
38
-
39
-
40
-
41
-
42
-
43
-
44
-
45
-
46
-
47
-
48
-
49
-
50
-
51
-
52
-
53
-
54
-
55
-
56
-
57
-
58
-
59
-
60
-
61
-
62
-
63
-
64
-
65
-
66
-
67
-
68
-
69
-
70
-
71
-
72
-
73
-
74
-
75
-
76
-
77
-
78
-
79
-
80
-
81
-
82
-
83
-
84
-
85
-
86
-
87
-
88
-
89
-
90
-
91
-
92
-
93
-
94
-
95
-
96
-
97
-
98
-
99
-
100
-
101
-
102
-
103
-
104
-
105
-
106
-
107
-
108
-
109
-
110
-
111
-
112
-
113
-
114
-
115
-
116
-
117
-
118
-
119
-
120
-
121
-
122
-
123
-
124
-
125
-
126
-
127
-
128
-
129
-
130
-
131
-
132
-
133
-
134
-
135
-
136
-
137
-
138
-
139
-
140
-
141
-
142
-
143
-
144
 |
 |

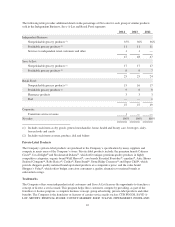
The following table provides additional detail on the percentage of Net sales for each group of similar products
sold in the Independent Business, Save-A-Lot and Retail Food segments:
2014 2013 2012
Independent Business:
Nonperishable grocery products (1) 35% 36% 36%
Perishable grocery products (2) 11 11 11
Services to independent retail customers and other 1 1 —
47 48 47
Save-A-Lot:
Nonperishable grocery products (1) 17 17 17
Perishable grocery products (2) 887
25 25 24
Retail Food:
Nonperishable grocery products (1) 15 16 17
Perishable grocery products (2) 988
Pharmacy products 3 3 3
Fuel — — 1
27 27 29
Corporate:
Transition service revenue 1 — —
Net sales 100% 100% 100%
(1) Includes such items as dry goods, general merchandise, home, health and beauty care, beverages, dairy,
frozen foods and candy
(2) Includes such items as meat, produce, deli and bakery
Private-Label Products
The Company’s private-label products are produced to the Company’s specification by many suppliers and
compete in many areas of the Company’s stores. Private-label products include: the premium brands Culinary
Circle®, Java Delight®and Stockman & Dakota®, which offer unique, premium quality products in highly
competitive categories; organic brand Wild Harvest®; core brands Essential Everyday®, equaline®, Artic Shores
Seafood Company®, Baby Basics®, Carlita®, Farm Stand®, Stone Ridge Creamery®and Super Chill®, which
provide shoppers quality national brand equivalent products at a competitive price; and the value brand
Shopper’s Value®, which offers budget conscious consumers a quality alternative to national brands at
substantial savings.
Trademarks
The Company offers some independent retail customers and Save-A-Lot licenses the opportunity to franchise a
concept or license a service mark. This program helps these customers compete by providing, as part of the
franchise or license program, a complete business concept, group advertising, private-label products and other
benefits. The Company is the franchisor or licensor of certain service marks such as CUB FOODS, SAVE-A-
LOT, SENTRY, FESTIVAL FOODS, COUNTY MARKET, SHOP ’N SAVE, NEWMARKET, FOODLAND,
10