Albertsons 2014 Annual Report Download - page 115
Download and view the complete annual report
Please find page 115 of the 2014 Albertsons annual report below. You can navigate through the pages in the report by either clicking on the pages listed below, or by using the keyword search tool below to find specific information within the annual report.-
 1
1 -
2
-
3
-
4
-
5
-
6
-
7
-
8
-
9
-
10
-
11
-
12
-
13
-
14
-
15
-
16
-
17
-
18
-
19
-
20
-
21
-
22
-
23
-
24
-
25
-
26
-
27
-
28
-
29
-
30
-
31
-
32
-
33
-
34
-
35
-
36
-
37
-
38
-
39
-
40
-
41
-
42
-
43
-
44
-
45
-
46
-
47
-
48
-
49
-
50
-
51
-
52
-
53
-
54
-
55
-
56
-
57
-
58
-
59
-
60
-
61
-
62
-
63
-
64
-
65
-
66
-
67
-
68
-
69
-
70
-
71
-
72
-
73
-
74
-
75
-
76
-
77
-
78
-
79
-
80
-
81
-
82
-
83
-
84
-
85
-
86
-
87
-
88
-
89
-
90
-
91
-
92
-
93
-
94
-
95
-
96
-
97
-
98
-
99
-
100
-
101
-
102
-
103
-
104
-
 105
105 -
 106
106 -
 107
107 -
 108
108 -
 109
109 -
 110
110 -
 111
111 -
 112
112 -
 113
113 -
 114
114 -
 115
115 -
 116
116 -
 117
117 -
 118
118 -
 119
119 -
 120
120 -
 121
121 -
 122
122 -
 123
123 -
 124
124 -
 125
125 -
126
-
127
-
128
-
129
-
130
-
131
-
132
-
133
-
134
-
135
-
136
-
137
-
138
-
139
-
140
-
141
-
142
-
143
-
144
 |
 |

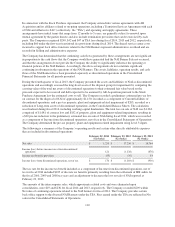
UNAUDITED QUARTERLY FINANCIAL INFORMATION
(In millions, except per share data)
Unaudited quarterly financial information for SUPERVALU INC. and subsidiaries is as follows:
2014
First
(16 weeks)
Second
(12 weeks)
Third
(12 weeks)
Fourth
(12 weeks)
Fiscal Year
(52 weeks)
Net sales (1) $ 5,242 $ 3,948 $ 4,012 $ 3,953 $ 17,155
Gross profit $ 796 $ 577 $ 569 $ 590 $ 2,532
Net (loss) earnings from continuing
operations (2) $ (105) $ 39 $ 32 $ 40 $ 6
Net earnings $ 85 $ 40 $ 31 $ 26 $ 182
Net (loss) earnings per share from
continuing operations—diluted (3) $ (0.43) $ 0.15 $ 0.12 $ 0.15 $ 0.02
Net earnings per share—diluted $ 0.34 $ 0.15 $ 0.12 $ 0.10 $ 0.70
Dividends declared per share $ — $ — $ — $ — $ —
Weighted average shares—diluted 250 261 262 261 258
2013
First
(16 weeks)
Second
(12 weeks)
Third
(12 weeks)
Fourth
(12 weeks)
Fiscal Year
(52 weeks)
Net sales (1) $ 5,250 $ 3,939 $ 4,051 $ 3,899 $ 17,139
Gross profit $ 720 $ 529 $ 530 $ 557 $ 2,336
Net loss from continuing operations (5) $ (18) $ (56) $ (15) $ (174) $ (263)
Net earnings (loss) $ 41 $ (111) $ 16 $ (1,412) $ (1,466)
Net loss per share from continuing
operations—diluted (3) $ (0.08) $ (0.26) $ (0.07) $ (0.82) $ (1.24)
Net earnings (loss) per share—diluted (4) $ 0.19 $ (0.52) $ 0.08 $ (6.65) $ (6.91)
Dividends declared per share $ 0.0875 $ — $ — $ — $ 0.0875
Weighted average shares—diluted 214 212 214 212 212
(1) During the second quarter of fiscal 2014, the Company revised its presentation of fees earned under its
transition services agreements. The Company historically presented fees earned under its transition services
agreements as a reduction of Selling and administrative expenses. The presentation of such fees earned has
been revised and they are now reflected as revenue, within Net sales of Corporate, for all periods. The
revision had the effect of increasing both Net sales and Gross profit, with a corresponding increase in
Selling and administrative expenses. These revisions did not impact Operating earnings (loss), Loss from
continuing operations before income taxes, Net earnings (loss), cash flows, or financial position for any
period reported.
(2) Results from continuing operations for the fiscal year ended February 22, 2014 include net costs and charges
of $235 before tax ($144 after tax, or $0.56 per diluted share), comprised of charges for the write-off of non-
cash unamortized financing costs and original issue discount acceleration of $99 before tax ($60 after tax, or
$0.24 per diluted share) and debt refinancing costs of $75 before tax ($47 after tax, or $0.18 per diluted
share) recorded in Interest expense, net, severance costs and accelerated stock-based compensation charges
of $46 before tax ($29 after tax, or $0.11 per diluted share), non-cash asset impairment and other charges of
113