Albertsons 2014 Annual Report Download - page 43
Download and view the complete annual report
Please find page 43 of the 2014 Albertsons annual report below. You can navigate through the pages in the report by either clicking on the pages listed below, or by using the keyword search tool below to find specific information within the annual report.-
 1
1 -
2
-
3
-
4
-
5
-
6
-
7
-
8
-
9
-
10
-
11
-
12
-
13
-
14
-
15
-
16
-
17
-
18
-
19
-
20
-
21
-
22
-
23
-
24
-
25
-
26
-
27
-
28
-
29
-
30
-
31
-
32
-
 33
33 -
 34
34 -
 35
35 -
 36
36 -
 37
37 -
 38
38 -
 39
39 -
 40
40 -
 41
41 -
 42
42 -
 43
43 -
 44
44 -
 45
45 -
 46
46 -
 47
47 -
 48
48 -
 49
49 -
 50
50 -
 51
51 -
 52
52 -
 53
53 -
54
-
55
-
56
-
57
-
58
-
59
-
60
-
61
-
62
-
63
-
64
-
65
-
66
-
67
-
68
-
69
-
70
-
71
-
72
-
73
-
74
-
75
-
76
-
77
-
78
-
79
-
80
-
81
-
82
-
83
-
84
-
85
-
86
-
87
-
88
-
89
-
90
-
91
-
92
-
93
-
94
-
95
-
96
-
97
-
98
-
99
-
100
-
101
-
102
-
103
-
104
-
105
-
106
-
107
-
108
-
109
-
110
-
111
-
112
-
113
-
114
-
115
-
116
-
117
-
118
-
119
-
120
-
121
-
122
-
123
-
124
-
125
-
126
-
127
-
128
-
129
-
130
-
131
-
132
-
133
-
134
-
135
-
136
-
137
-
138
-
139
-
140
-
141
-
142
-
143
-
144
 |
 |

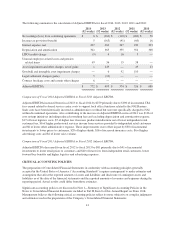
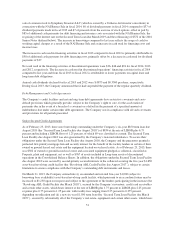
The following summarizes the calculation of Adjusted EBITDA for fiscal 2014, 2013, 2012, 2011 and 2010:
2014
(52 weeks)
2013
(52 weeks)
2012
(52 weeks)
2011
(52 weeks)
2010
(52 weeks)
Net earnings (loss) from continuing operations $ 6 $ (263) $ (110) $ (200) $ 50
Income tax provision (benefit) 5 (163) (41) (60) 16
Interest expense, net 407 269 247 230 223
Depreciation and amortization 302 365 355 354 368
LIFO (credit) charge (9) 4 16 5 —
Unusual employee-related costs and pension
related items 49 36 15 38 —
Asset impairment and other charges, net of gains 1 249 — 49 23
Goodwill and intangible asset impairment charges — 6 92 110 —
Legal settlement charges (gains) 5 (10) — — —
Contract breakage costs and certain other charges 6————
Adjusted EBITDA $ 772 $ 493 $ 574 $ 526 $ 680
Comparison of Fiscal 2014 Adjusted EBITDA to Fiscal 2013 Adjusted EBITDA
Adjusted EBITDA increased from fiscal 2013 to fiscal 2014 by $279 primarily due to $198 of incremental TSA
fees earned related to shared service center costs to support back office functions related to the NAI Banners.
Such costs have been historically incurred as administrative overhead but were not specifically charged to NAI
within discontinued operations. Also contributing to the increase in Adjusted EBITDA in fiscal 2014 was $126 of
cost savings initiatives including reduced consulting fees and excluding depreciation and amortization expense,
$17 of lower logistics costs, $7 of higher fees from new product introductions net of lower independent retail
customer fees, $6 of higher professional services income from services provided to independent retail customers
and $6 of lower other administrative expense. These improvements were offset in part by $30 of incremental
investments to lower prices to customers, $28 of higher shrink, $16 of increased insurance costs, $6 of higher
advertising costs and $2 of lower sales volume.
Comparison of Fiscal 2013 Adjusted EBITDA to Fiscal 2012 Adjusted EBITDA
Adjusted EBITDA decreased from fiscal 2012 to fiscal 2013 by $81 primarily due to $41 of incremental
investments to lower retail prices to customers and $40 of lower fees from independent retail customers, lower
forward buy benefits and higher logistics and advertising expenses.
CRITICAL ACCOUNTING POLICIES
The preparation of Consolidated Financial Statements in conformity with accounting principles generally
accepted in the United States of America (“Accounting Standards”) requires management to make estimates and
assumptions that affect the reported amounts of assets and liabilities and disclosure of contingent assets and
liabilities as of the date of the financial statements and the reported amounts of revenues and expenses during the
reporting period. Actual results could differ from those estimates.
Significant accounting policies are discussed in Note 1—Summary of Significant Accounting Policies in the
Notes to Consolidated Financial Statements included in Part II, Item 8 of this Annual Report on Form 10-K.
Management believes the following critical accounting policies reflect its more subjective or complex judgments
and estimates used in the preparation of the Company’s Consolidated Financial Statements.
41