Albertsons 2014 Annual Report Download - page 69
Download and view the complete annual report
Please find page 69 of the 2014 Albertsons annual report below. You can navigate through the pages in the report by either clicking on the pages listed below, or by using the keyword search tool below to find specific information within the annual report.-
 1
1 -
2
-
3
-
4
-
5
-
6
-
7
-
8
-
9
-
10
-
11
-
12
-
13
-
14
-
15
-
16
-
17
-
18
-
19
-
20
-
21
-
22
-
23
-
24
-
25
-
26
-
27
-
28
-
29
-
30
-
31
-
32
-
33
-
34
-
35
-
36
-
37
-
38
-
39
-
40
-
41
-
42
-
43
-
44
-
45
-
46
-
47
-
48
-
49
-
50
-
51
-
52
-
53
-
54
-
55
-
56
-
57
-
58
-
 59
59 -
 60
60 -
 61
61 -
 62
62 -
 63
63 -
 64
64 -
 65
65 -
 66
66 -
 67
67 -
 68
68 -
 69
69 -
 70
70 -
 71
71 -
 72
72 -
 73
73 -
 74
74 -
 75
75 -
 76
76 -
 77
77 -
 78
78 -
 79
79 -
80
-
81
-
82
-
83
-
84
-
85
-
86
-
87
-
88
-
89
-
90
-
91
-
92
-
93
-
94
-
95
-
96
-
97
-
98
-
99
-
100
-
101
-
102
-
103
-
104
-
105
-
106
-
107
-
108
-
109
-
110
-
111
-
112
-
113
-
114
-
115
-
116
-
117
-
118
-
119
-
120
-
121
-
122
-
123
-
124
-
125
-
126
-
127
-
128
-
129
-
130
-
131
-
132
-
133
-
134
-
135
-
136
-
137
-
138
-
139
-
140
-
141
-
142
-
143
-
144
 |
 |

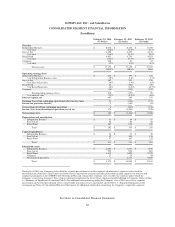
SUPERVALU INC. and Subsidiaries
CONSOLIDATED STATEMENTS OF CASH FLOWS
(In millions)
February 22,
2014
(52 weeks)
February 23,
2013
(52 weeks)
February 25,
2012
(52 weeks)
Cash flows from operating activities
Net earnings (loss) $ 182 $ (1,466) $ (1,040)
Income (loss) from discontinued operations, net of tax 176 (1,203) (930)
Net earnings (loss) from continuing operations 6 (263) (110)
Adjustments to reconcile Net earnings (loss) from continuing operations to Net cash provided
by operating activities—continuing operations:
Goodwill and intangible asset impairment charges — 6 92
Asset impairment and other charges 194 283 6
Net gain on sale of assets and exits of surplus leases (17) (6) (25)
Depreciation and amortization 302 365 355
LIFO (credit) charge (9) 4 16
Deferred income taxes (39) (50) 13
Stock-based compensation 22 13 13
Net pension and other postretirement benefits cost 79 102 106
Contributions to pension and other postretirement benefit plans (124) (98) (83)
Other adjustments 32 26 21
Changes in operating assets and liabilities:
Receivables (54) 30 (6)
Inventories 25110
Accounts payable and accrued liabilities (127) (69) (108)
Income taxes (79) 75 55
Other changes in operating assets and liabilities (68) (52) (27)
Net cash provided by operating activities—continuing operations 120 417 328
Net cash (used in) provided by operating activities—discontinued operations (101) 481 728
Net cash provided by operating activities 19 898 1,056
Cash flows from investing activities
Proceeds from sale of assets 14 38 29
Purchases of property, plant and equipment (111) (228) (402)
Other 1113
Net cash used in investing activities—continuing operations (86) (189) (370)
Net cash provided by (used in) investing activities—discontinued operations 135 (175) (114)
Net cash provided by (used in) investing activities 49 (364) (484)
Cash flows from financing activities
Proceeds from issuance of debt 2,098 1,713 291
Proceeds from the sale of common stock 177 — —
Payments of debt and capital lease obligations (2,221) (2,099) (700)
Payments for debt financing costs (151) (66) (8)
Dividends paid — (37) (74)
Other (1) (7) (2)
Net cash used in financing activities—continuing operations (98) (496) (493)
Net cash used in financing activities—discontinued operations (36) (46) (94)
Net cash used in financing activities (134) (542) (587)
Net decrease in cash and cash equivalents (66) (8) (15)
Cash and cash equivalents at beginning of year 149 157 172
Cash and cash equivalents at end of year $ 83 $ 149 $ 157
Less cash and cash equivalents of discontinued operations at end of year — (77) (93)
Cash and cash equivalents of continuing operations at end of year $83$72$64
SUPPLEMENTAL CASH FLOW INFORMATION
The Company’s non-cash activities were as follows:
Capital lease asset additions $ 2 $ 13 $ 1
Purchases of property, plant and equipment included in Accounts payable $ 19 $ 10 $ 44
Interest and income taxes paid:
Interest paid (net of amounts capitalized) $ 227 $ 232 $ 227
Income taxes paid (net of refunds) $ 118 $ 31 $ 73
See Notes to Consolidated Financial Statements.
67