Albertsons 2014 Annual Report Download - page 52
Download and view the complete annual report
Please find page 52 of the 2014 Albertsons annual report below. You can navigate through the pages in the report by either clicking on the pages listed below, or by using the keyword search tool below to find specific information within the annual report.-
 1
1 -
2
-
3
-
4
-
5
-
6
-
7
-
8
-
9
-
10
-
11
-
12
-
13
-
14
-
15
-
16
-
17
-
18
-
19
-
20
-
21
-
22
-
23
-
24
-
25
-
26
-
27
-
28
-
29
-
30
-
31
-
32
-
33
-
34
-
35
-
36
-
37
-
38
-
39
-
40
-
41
-
 42
42 -
 43
43 -
 44
44 -
 45
45 -
 46
46 -
 47
47 -
 48
48 -
 49
49 -
 50
50 -
 51
51 -
 52
52 -
 53
53 -
 54
54 -
 55
55 -
 56
56 -
 57
57 -
 58
58 -
 59
59 -
 60
60 -
 61
61 -
 62
62 -
63
-
64
-
65
-
66
-
67
-
68
-
69
-
70
-
71
-
72
-
73
-
74
-
75
-
76
-
77
-
78
-
79
-
80
-
81
-
82
-
83
-
84
-
85
-
86
-
87
-
88
-
89
-
90
-
91
-
92
-
93
-
94
-
95
-
96
-
97
-
98
-
99
-
100
-
101
-
102
-
103
-
104
-
105
-
106
-
107
-
108
-
109
-
110
-
111
-
112
-
113
-
114
-
115
-
116
-
117
-
118
-
119
-
120
-
121
-
122
-
123
-
124
-
125
-
126
-
127
-
128
-
129
-
130
-
131
-
132
-
133
-
134
-
135
-
136
-
137
-
138
-
139
-
140
-
141
-
142
-
143
-
144
 |
 |

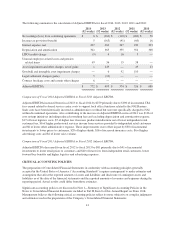
fiscal 2012 to 2013 due to inventory management and store closures. The increase in cash used in accounts
payable and accrued liabilities in fiscal 2014 compared to fiscal 2013 is attributable to lower employee-related
payables associated with the fiscal 2014 workforce reduction. The remaining net increase in cash provided by
operating activities from continuing operations is primarily related to cash provided from an increase in Net
earnings from continuing operations, after adjusting for non-cash impacts of asset impairment and other charges,
depreciation and amortization expense, net gain on the sale of assets and surplus leases, deferred taxes and LIFO
credit, largely attributable to TSA revenues offsetting previously stranded costs and cost savings initiatives,
offset in part by employee benefit plan contributions in excess of related expenses.
The increase in net cash provided by operating activities from continuing operations in fiscal 2013 compared to
fiscal 2012 is primarily attributable to an increase in cash provided from changes in operating assets and
liabilities of $111 due to less cash used in inventories, net of related payables, offset in part by more cash used in
employee-related costs.
Net cash (used in) provided by operating activities from discontinued operations was $(101), $481 and $728 for
fiscal 2014, 2013 and 2012, respectively. The decrease in net cash provided by operating activities from
discontinued operations in fiscal 2014 is primarily due to the NAI Banner Sale, resulting in reduced cash flow
from that business during fiscal 2014, and cash payments made for accrued liabilities and accounts payable
related to the Stock Purchase Agreement during the first quarter of fiscal 2014. The decrease in cash provided by
operating activities from discontinued operations in fiscal 2013 compared to fiscal 2012 is attributable to a
decrease in cash provided from net loss from discontinued operations after adjusting for non-cash items of $185
primarily due to reduced cash generated from discontinued operations and an increase in cash used in working
capital and other operating assets and liabilities of $62.
Investing Activities
Net cash used in investing activities from continuing operations was $86, $189 and $370 in fiscal 2014, 2013 and
2012, respectively. The decrease in cash used in investing activities in fiscal 2014 compared to last year is
primarily attributable to $117 less cash used for capital expenditures attributable to remodeling activity,
technology expenditures and new retail stores, and $24 of lower cash proceeds from the sale of assets primarily
attributable to proceeds from the sale of a distribution center in fiscal 2013.
The decrease in cash used in investing activities in fiscal 2013 compared to fiscal 2012 is primarily attributable to
$152 less cash used in the payments for capital expenditures attributable to remodeling activity, new retail stores
and technology in fiscal 2013.
Net cash provided by (used in) investing activities from discontinued operations was $135, $(175) and $(114) for
fiscal 2014, 2013 and 2012, respectively. The increase in net cash provided by investing activities from
discontinued operations from fiscal 2014 compared to last year is primarily due to $257 of lower cash payments
toward discontinued operations’ capital expenditures due to the completion of the NAI Banner Sale,
approximately $144 in proceeds received from the NAI Banner Sale, including the collection of the $44 NAI
note receivable, in fiscal 2014, offset in part by approximately $90 of proceeds from the sale of discontinued
operations’ assets during fiscal 2013. The increase in net cash used in investing activities from discontinued
operations from fiscal 2012 to fiscal 2013 is due to $53 of lower proceeds from the sale of assets primarily
attributable to $89 in cash received from the sale of fuel centers in fiscal 2012, offset in part by proceeds from the
sale of pharmacy scripts and closed stores in fiscal 2013, and higher capital expenditures.
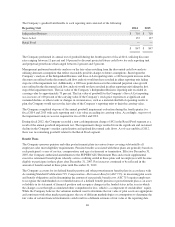
Financing Activities
Net cash used in financing activities from continuing operations was $98, $496 and $493 for fiscal 2014, 2013
and 2012, respectively. The decrease in cash used in financing activities in fiscal 2014 compared to last year is
primarily attributable to $263 of lower net debt and capital lease payments, $170 of proceeds received from the
50