Albertsons 2014 Annual Report Download - page 34
Download and view the complete annual report
Please find page 34 of the 2014 Albertsons annual report below. You can navigate through the pages in the report by either clicking on the pages listed below, or by using the keyword search tool below to find specific information within the annual report.-
 1
1 -
2
-
3
-
4
-
5
-
6
-
7
-
8
-
9
-
10
-
11
-
12
-
13
-
14
-
15
-
16
-
17
-
18
-
19
-
20
-
21
-
22
-
23
-
 24
24 -
 25
25 -
 26
26 -
 27
27 -
 28
28 -
 29
29 -
 30
30 -
 31
31 -
 32
32 -
 33
33 -
 34
34 -
 35
35 -
 36
36 -
 37
37 -
 38
38 -
 39
39 -
 40
40 -
 41
41 -
 42
42 -
 43
43 -
 44
44 -
45
-
46
-
47
-
48
-
49
-
50
-
51
-
52
-
53
-
54
-
55
-
56
-
57
-
58
-
59
-
60
-
61
-
62
-
63
-
64
-
65
-
66
-
67
-
68
-
69
-
70
-
71
-
72
-
73
-
74
-
75
-
76
-
77
-
78
-
79
-
80
-
81
-
82
-
83
-
84
-
85
-
86
-
87
-
88
-
89
-
90
-
91
-
92
-
93
-
94
-
95
-
96
-
97
-
98
-
99
-
100
-
101
-
102
-
103
-
104
-
105
-
106
-
107
-
108
-
109
-
110
-
111
-
112
-
113
-
114
-
115
-
116
-
117
-
118
-
119
-
120
-
121
-
122
-
123
-
124
-
125
-
126
-
127
-
128
-
129
-
130
-
131
-
132
-
133
-
134
-
135
-
136
-
137
-
138
-
139
-
140
-
141
-
142
-
143
-
144
 |
 |
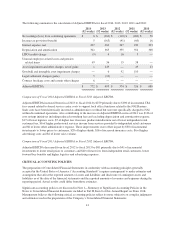
Consolidated results for fiscal 2014 include net costs and charges of $235 before tax ($144 after tax, or $0.56 per
diluted share), comprised of charges for the write-off of non-cash unamortized financing costs and original issue
discount acceleration of $99 before tax ($60 after tax, or $0.24 per diluted share) and debt refinancing costs of
$75 before tax ($47 after tax, or $0.18 per diluted share) recorded in Interest expense, net, severance costs and
accelerated stock-based compensation charges of $46 before tax ($29 after tax, or $0.11 per diluted share), non-
cash asset impairment and other charges of $16 before tax ($11 after tax, or $0.04 per diluted share), contract
breakage and other costs of $6 before tax ($2 after tax, or $0.01 per diluted share) and a legal settlement charge
of $5 before tax ($3 after tax, or $0.01 per diluted share) recorded in Selling and administrative expenses, and a
multi-employer pension withdrawal charge of $3 before tax ($2 after tax, or $0.01 per diluted share) recorded in
Gross profit, offset in part by a gain on sale of property of $15 before tax ($10 after tax, or $0.04 per diluted
share) recorded in Selling and administrative expenses.
During fiscal 2014, the Company added 40 new stores through new store development, comprised of 10
corporate-operated stores and 30 licensee-operated stores, and closed 42 stores, comprised of 40 licensee-owned
stores, one corporate-operated Save-A-Lot store and one Retail Food store lease expiration. Total retail square
footage as of the end of fiscal 2014 was approximately 17.4 million, a decrease of approximately 0.3 percent
from the end of fiscal 2013. Total retail square footage, excluding actual and planned store dispositions,
increased 0.9 percent from the end of fiscal 2013.
Net Sales
Net sales for fiscal 2014 were $17,155, compared with $17,139 last year, an increase of $16. Independent
Business net sales were 46.8 percent of Net sales, Save-A-Lot net sales were 24.6 percent of Net sales, Retail
Food net sales were 27.1 percent of Net sales and Corporate fees earned under the TSA were 1.5 percent of Net
sales for fiscal 2014, compared with 47.6 percent, 24.5 percent, 27.7 percent and 0.2 percent, respectively, for
last year.
Net sales for fiscal 2014 include fees earned under the TSA of $240, compared with $42 last year, an increase of
$198. The net sales increase reflects a higher number of stores and distribution centers supported under the TSA
following the NAI Banner Sale in March of 2013, and an incremental $60 one-year transition fee earned under
the TSA in fiscal 2014.
Independent Business net sales for fiscal 2014 were $8,036, compared with $8,166 last year, a decrease of $130
or 1.6 percent. The decrease is primarily due to lower sales to existing customers including military and two
larger lost accounts, offset in part by net new business including sales to one NAI banner.
Save-A-Lot net sales for fiscal 2014 were $4,228, compared with $4,195 last year, an increase of $33 or 0.8
percent. The increase is primarily due to an increase of $148 in sales due to new store openings and positive
network identical store sales of 0.2 percent or $9 (defined as net sales from Company-operated stores and sales to
licensee stores operating for four full quarters, including store expansions and excluding planned store
dispositions), offset in part by a decrease of $124 in sales due to store dispositions.
Save-A-Lot identical store sales for Company-operated stores (defined as net sales from Company-operated
stores operating for four full quarters, including store expansions and excluding planned store dispositions) were
positive 2.6 percent or $41 for fiscal 2014. Save-A-Lot corporate identical store sales performance was primarily
a result of a 1.9 percent increase in average basket size and a 0.7 percent increase in customer count.
Retail Food net sales for fiscal 2014 were $4,651 compared with $4,736 last year, a decrease of $85 or 1.8
percent. The decrease is primarily due to negative identical store sales of 1.5 percent or $71 (defined as net sales
from stores operating for four full quarters, including store expansions and excluding fuel and planned store
dispositions) and a decrease in fuel sales of $11. Retail Food negative identical store sales performance was
primarily a result of a 1.7 percent customer count decline attributable to a continued price-focused, competitive
environment, offset in part by a 0.2 percent increase in average basket size.
32