Albertsons 2014 Annual Report Download - page 39
Download and view the complete annual report
Please find page 39 of the 2014 Albertsons annual report below. You can navigate through the pages in the report by either clicking on the pages listed below, or by using the keyword search tool below to find specific information within the annual report.-
 1
1 -
2
-
3
-
4
-
5
-
6
-
7
-
8
-
9
-
10
-
11
-
12
-
13
-
14
-
15
-
16
-
17
-
18
-
19
-
20
-
21
-
22
-
23
-
24
-
25
-
26
-
27
-
28
-
 29
29 -
 30
30 -
 31
31 -
 32
32 -
 33
33 -
 34
34 -
 35
35 -
 36
36 -
 37
37 -
 38
38 -
 39
39 -
 40
40 -
 41
41 -
 42
42 -
 43
43 -
 44
44 -
 45
45 -
 46
46 -
 47
47 -
 48
48 -
 49
49 -
50
-
51
-
52
-
53
-
54
-
55
-
56
-
57
-
58
-
59
-
60
-
61
-
62
-
63
-
64
-
65
-
66
-
67
-
68
-
69
-
70
-
71
-
72
-
73
-
74
-
75
-
76
-
77
-
78
-
79
-
80
-
81
-
82
-
83
-
84
-
85
-
86
-
87
-
88
-
89
-
90
-
91
-
92
-
93
-
94
-
95
-
96
-
97
-
98
-
99
-
100
-
101
-
102
-
103
-
104
-
105
-
106
-
107
-
108
-
109
-
110
-
111
-
112
-
113
-
114
-
115
-
116
-
117
-
118
-
119
-
120
-
121
-
122
-
123
-
124
-
125
-
126
-
127
-
128
-
129
-
130
-
131
-
132
-
133
-
134
-
135
-
136
-
137
-
138
-
139
-
140
-
141
-
142
-
143
-
144
 |
 |
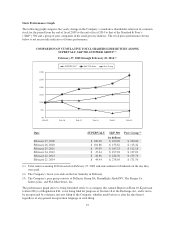
Independent Business net sales for fiscal 2013 were $8,166, compared with $8,194 for fiscal 2012, a decrease of
$28 or 0.3 percent. The decrease is primarily due to lower like sales to existing customers offset in part by
increased sales from net new business.
Save-A-Lot net sales for fiscal 2013 were $4,195 compared with $4,221 for fiscal 2012, a decrease of $26 or 0.6
percent. The decrease is primarily due to negative network identical store sales of 3.3 percent or $120 (defined as
net sales from Company-operated stores and sales to licensee stores operating for four full quarters, including
store expansions and excluding planned store dispositions) and $111 due to store dispositions, partially offset by
an increase of $205 in sales due to new store openings.
Save-A-Lot identical store sales for Company-operated stores (defined as net sales from Company-operated
stores operating for four full quarters, including store expansions and excluding planned store dispositions) were
negative 5.1 percent or $79 for fiscal 2013. Save-A-Lot corporate identical store sales performance was primarily
a result of a 4.1 decrease in customer count and a 1.0 percent decrease in average basket size.
Retail Food net sales for fiscal 2013 were $4,736, compared with $4,921 for fiscal 2012, a decrease of $185, or
3.8 percent. The decrease is primarily due to negative identical store sales of 2.4 percent or $117 (defined as net
sales from stores operating for four full quarters, including store expansions and excluding fuel and planned store
dispositions) and impacts from decreased fuel sales due to the divestiture of ten fuel centers and planned store
dispositions. Retail Food negative identical store sales performance was primarily a result of continued price-
focused competitive activity and the challenging economic environment. During fiscal 2013, customer counts
declined approximately 1.9 percent while average basket size decreased approximately 0.5 percent driven by
moderate levels of inflation and fewer items per customer.
Corporate net sales from transition service agreements for fiscal 2013 was $42, compared with $47 for fiscal
2012, a decrease of $5 or 10.6 percent due to a decline in the number of stores and distribution centers supported.
Gross Profit
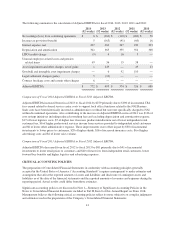
Gross profit for fiscal 2013 was $2,336, compared with $2,457 for fiscal 2012, a decrease of $121 or 4.9 percent.
The decrease in Gross profit dollars is primarily due to a $39 decline in the Company’s sales volume and
declines in gross margin rates within certain of the Company’s business segments. Gross profit, as a percent of
Net sales, was 13.6 percent for fiscal 2013 compared with 14.1 percent for fiscal 2012.
Independent Business gross profit as a percent of Independent Business Net sales was 4.5 percent for fiscal 2013
compared to 4.8 percent for fiscal 2012. The 30 basis point decline in Independent Business gross profit is
primarily due to a 50 basis point impact from gross margin investment and change in business mix offset in part
by a 20 basis point benefit from a lower LIFO charge and lower employee-related expenses.
Save-A-Lot gross profit as a percent of Save-A-Lot Net sales was 15.9 percent for fiscal 2013 compared with
17.1 percent for fiscal 2012. The 120 basis point decrease in Save-A-Lot gross profit rate is primarily due to a
100 basis point impact from competitive price investment with the remaining decrease primarily due to higher
advertising costs.
Retail Food gross profit as a percent of Retail Food Net sales was 26.7 percent for fiscal 2013 compared with
26.3 percent for fiscal 2012. The 40 basis point increase in Retail Food gross profit rate is primarily due to higher
margins on generic prescriptions, lower LIFO charge and lower employee-related costs.
Selling and Administrative Expenses
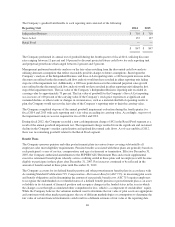
Selling and administrative expenses for fiscal 2013 were $2,487, compared with $2,269 for fiscal 2012, an
increase of $218 or 9.6 percent. Included in Selling and administrative expenses is a net $275 charge including
non-cash property, plant and equipment impairment charges of $227 predominantly related to abandoned
software projects. In addition, Selling and administrative costs included employee-related expenses, comprised
37