Albertsons 2014 Annual Report Download - page 33
Download and view the complete annual report
Please find page 33 of the 2014 Albertsons annual report below. You can navigate through the pages in the report by either clicking on the pages listed below, or by using the keyword search tool below to find specific information within the annual report.-
 1
1 -
2
-
3
-
4
-
5
-
6
-
7
-
8
-
9
-
10
-
11
-
12
-
13
-
14
-
15
-
16
-
17
-
18
-
19
-
20
-
21
-
22
-
 23
23 -
 24
24 -
 25
25 -
 26
26 -
 27
27 -
 28
28 -
 29
29 -
 30
30 -
 31
31 -
 32
32 -
 33
33 -
 34
34 -
 35
35 -
 36
36 -
 37
37 -
 38
38 -
 39
39 -
 40
40 -
 41
41 -
 42
42 -
 43
43 -
44
-
45
-
46
-
47
-
48
-
49
-
50
-
51
-
52
-
53
-
54
-
55
-
56
-
57
-
58
-
59
-
60
-
61
-
62
-
63
-
64
-
65
-
66
-
67
-
68
-
69
-
70
-
71
-
72
-
73
-
74
-
75
-
76
-
77
-
78
-
79
-
80
-
81
-
82
-
83
-
84
-
85
-
86
-
87
-
88
-
89
-
90
-
91
-
92
-
93
-
94
-
95
-
96
-
97
-
98
-
99
-
100
-
101
-
102
-
103
-
104
-
105
-
106
-
107
-
108
-
109
-
110
-
111
-
112
-
113
-
114
-
115
-
116
-
117
-
118
-
119
-
120
-
121
-
122
-
123
-
124
-
125
-
126
-
127
-
128
-
129
-
130
-
131
-
132
-
133
-
134
-
135
-
136
-
137
-
138
-
139
-
140
-
141
-
142
-
143
-
144
 |
 |

on the Company’s long-term plans to increase sales and operating cash flow, improve its balance sheet and
generate returns for its stockholders.
The Company will continue to be challenged by the slow rate of economic improvement and the competitive
markets in which the Company operates. Management expects consumer spending to be pressured by the overall
economic environment, and operating results for the Company will continue to be impacted in a highly
competitive and price-sensitive marketplace.
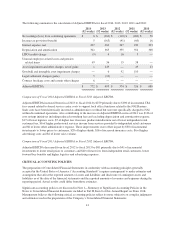
RESULTS OF OPERATIONS
The following discussion summarizes operating results in fiscal 2014 compared to fiscal 2013 and for fiscal 2013
compared to fiscal 2012.
(In millions, except per share data)
February 22,
2014
(52 weeks)
February 23,
2013
(52 weeks)
February 25,
2012
(52 weeks)
Net sales $ 17,155 100.0% $ 17,139 100.0% $ 17,383 100.0%
Cost of sales 14,623 85.2 14,803 86.4 14,926 85.9
Gross profit 2,532 14.8 2,336 13.6 2,457 14.1
Selling and administrative expenses 2,114 12.3 2,487 14.5 2,269 13.1
Goodwill and intangible asset impairment charges — — 6 — 92 0.5
Operating earnings (loss) 418 2.4 (157) (0.9) 96 0.6
Interest expense, net 407 2.4 269 1.6 247 1.4
Earnings (loss) from continuing operations before income taxes 11 0.1 (426) (2.5) (151) (0.9)
Income tax provision (benefit) 5 — (163) (1.0) (41) (0.2)
Net earnings (loss) from continuing operations 6 — (263) (1.5) (110) (0.6)
Income (loss) from discontinued operations, net of tax 176 1.0 (1,203) (7.0) (930) (5.4)
Net earnings (loss) $ 182 1.1% $ (1,466) (8.6)% $ (1,040) (6.0)%
Basic net earnings (loss) per common share:
Net earnings (loss) per share from continuing operations $ 0.02 $ (1.24) $ (0.52)
Net earnings (loss) per share from discontinued
operations $ 0.69 $ (5.67) $ (4.39)
Net earnings (loss) per common share $ 0.71 $ (6.91) $ (4.91)
Diluted net earnings (loss) per common share:
Net earnings (loss) per share from continuing operations $ 0.02 $ (1.24) $ (0.52)
Net earnings (loss) per share from discontinued
operations $ 0.68 $ (5.67) $ (4.39)
Net earnings (loss) per common share $ 0.70 $ (6.91) $ (4.91)
Comparison of fiscal 2014 ended February 22, 2014 and fiscal 2013 ended February 23, 2013:
Summary
Consolidated Net sales for fiscal 2014 were $17,155, compared with $17,139 last year. Net earnings from
continuing operations for fiscal 2014 were $6, or $0.02 per basic and diluted share, compared with Net loss from
continuing operations of $263, or $1.24 per basic and diluted share last year.
31