Albertsons 2014 Annual Report Download - page 64
Download and view the complete annual report
Please find page 64 of the 2014 Albertsons annual report below. You can navigate through the pages in the report by either clicking on the pages listed below, or by using the keyword search tool below to find specific information within the annual report.-
 1
1 -
2
-
3
-
4
-
5
-
6
-
7
-
8
-
9
-
10
-
11
-
12
-
13
-
14
-
15
-
16
-
17
-
18
-
19
-
20
-
21
-
22
-
23
-
24
-
25
-
26
-
27
-
28
-
29
-
30
-
31
-
32
-
33
-
34
-
35
-
36
-
37
-
38
-
39
-
40
-
41
-
42
-
43
-
44
-
45
-
46
-
47
-
48
-
49
-
50
-
51
-
52
-
53
-
 54
54 -
 55
55 -
 56
56 -
 57
57 -
 58
58 -
 59
59 -
 60
60 -
 61
61 -
 62
62 -
 63
63 -
 64
64 -
 65
65 -
 66
66 -
 67
67 -
 68
68 -
 69
69 -
 70
70 -
 71
71 -
 72
72 -
 73
73 -
 74
74 -
75
-
76
-
77
-
78
-
79
-
80
-
81
-
82
-
83
-
84
-
85
-
86
-
87
-
88
-
89
-
90
-
91
-
92
-
93
-
94
-
95
-
96
-
97
-
98
-
99
-
100
-
101
-
102
-
103
-
104
-
105
-
106
-
107
-
108
-
109
-
110
-
111
-
112
-
113
-
114
-
115
-
116
-
117
-
118
-
119
-
120
-
121
-
122
-
123
-
124
-
125
-
126
-
127
-
128
-
129
-
130
-
131
-
132
-
133
-
134
-
135
-
136
-
137
-
138
-
139
-
140
-
141
-
142
-
143
-
144
 |
 |

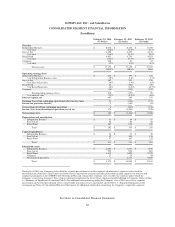
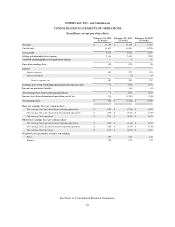
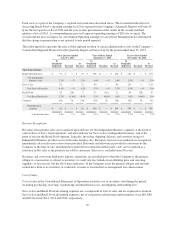
SUPERVALU INC. and Subsidiaries
CONSOLIDATED SEGMENT FINANCIAL INFORMATION
(In millions)
February 22, 2014
(52 weeks)
February 23, 2013
(52 weeks)
February 25, 2012
(52 weeks)
Net sales
Independent Business $ 8,036 $ 8,166 $ 8,194
% of total 46.8% 47.6% 47.1%
Save-A-Lot 4,228 4,195 4,221
% of total 24.6% 24.5% 24.3%
Retail Food 4,651 4,736 4,921
% of total 27.1% 27.7% 28.3%
Corporate 240 42 47
% of total 1.5% 0.2% 0.3%
Total net sales $ 17,155 $ 17,139 $ 17,383
100.0% 100.0% 100.0
Operating earnings (loss)
Independent Business $ 235 $ 199 $ 254
% of Independent Business sales 2.9% 2.4% 3.1%
Save-A-Lot 167 143 230
% of Save-A-Lot sales 3.9% 3.4% 5.4%
Retail Food 72 (160) (36)
% of Retail Food sales 1.6% (3.4)% (0.7)%
Corporate (56) (339) (352)
Total operating earnings (loss) 418 (157) 96
% of total net sales 2.4% (0.9)% 0.6%
Interest expense, net 407 269 247
Earnings (loss) from continuing operations before income taxes 11 (426) (151)
Income tax provision (benefit) 5 (163) (41)
Net earnings (loss)from continuing operations 6 (263) (110)
Income (loss) from discontinued operations, net of tax 176 (1,203) (930)
Net earnings (loss) $ 182 $ (1,466) $ (1,040)
Depreciation and amortization
Independent Business $ 51 $ 64 $ 67
Save-A-Lot 64 68 62
Retail Food 187 233 226
Total $ 302 $ 365 $ 355
Capital expenditures
Independent Business $ 24 $ 33 $ 59
Save-A-Lot 42 101 130
Retail Food 47 107 214
Total $ 113 $ 241 $ 403
Identifiable assets
Independent Business $ 2,007 $ 1,857 $ 1,955
Save-A-Lot 925 936 867
Retail Food 1,415 1,695 2,229
Corporate 27 75 84
Discontinued operations — 6,471 6,966
Total $ 4,374 $ 11,034 $ 12,101
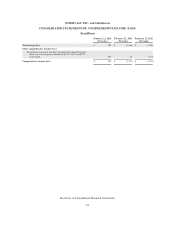
During fiscal 2014, the Company reclassified the segment presentation of certain corporate administrative expenses and revised the
presentation of related fees earned under transition services agreements, pension and other postretirement plan expenses for inactive and
corporate participants in the SUPERVALU Retirement Plan and certain other corporate costs to reflect the structure under which the
Company is now being managed. These changes primarily resulted in the recast of net expenses from Retail Food to Corporate. Refer to Note
1—Summary of Significant Accounting Policies for additional information regarding the Company’s fiscal 2014 recast of its segment
presentation and revised presentation of fees earned under transition services agreements and to Note 13—Segment Information in the
accompanying Notes to Consolidated Financial Statements for additional information concerning the Company’s reportable segments.
See Notes to Consolidated Financial Statements.
62