Albertsons 2014 Annual Report Download - page 90
Download and view the complete annual report
Please find page 90 of the 2014 Albertsons annual report below. You can navigate through the pages in the report by either clicking on the pages listed below, or by using the keyword search tool below to find specific information within the annual report.-
 1
1 -
2
-
3
-
4
-
5
-
6
-
7
-
8
-
9
-
10
-
11
-
12
-
13
-
14
-
15
-
16
-
17
-
18
-
19
-
20
-
21
-
22
-
23
-
24
-
25
-
26
-
27
-
28
-
29
-
30
-
31
-
32
-
33
-
34
-
35
-
36
-
37
-
38
-
39
-
40
-
41
-
42
-
43
-
44
-
45
-
46
-
47
-
48
-
49
-
50
-
51
-
52
-
53
-
54
-
55
-
56
-
57
-
58
-
59
-
60
-
61
-
62
-
63
-
64
-
65
-
66
-
67
-
68
-
69
-
70
-
71
-
72
-
73
-
74
-
75
-
76
-
77
-
78
-
79
-
 80
80 -
 81
81 -
 82
82 -
 83
83 -
 84
84 -
 85
85 -
 86
86 -
 87
87 -
 88
88 -
 89
89 -
 90
90 -
 91
91 -
 92
92 -
 93
93 -
 94
94 -
 95
95 -
 96
96 -
 97
97 -
 98
98 -
 99
99 -
 100
100 -
101
-
102
-
103
-
104
-
105
-
106
-
107
-
108
-
109
-
110
-
111
-
112
-
113
-
114
-
115
-
116
-
117
-
118
-
119
-
120
-
121
-
122
-
123
-
124
-
125
-
126
-
127
-
128
-
129
-
130
-
131
-
132
-
133
-
134
-
135
-
136
-
137
-
138
-
139
-
140
-
141
-
142
-
143
-
144
 |
 |
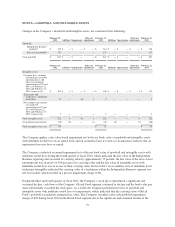
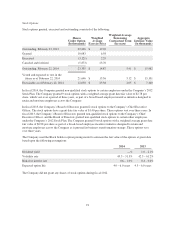
The difference between the actual tax provision (benefit) and the tax provision computed by applying the
statutory federal income tax rate to Earnings (loss) from continuing operations before income taxes is attributable
to the following:
2014 2013 2012
Federal taxes based on statutory rate $ 4 $ (149) $ (53)
State income taxes, net of federal benefit — (13) (9)
Goodwill and intangible asset impairment — — 32
Tax contingency (1) 1 (5)
Change in valuation allowance (1) (3) (5)
Other 3 1 (1)
Total income tax provision (benefit) $ 5 $ (163) $ (41)
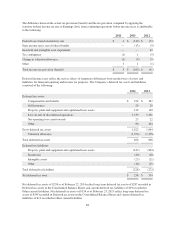
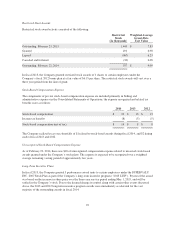
Deferred income taxes reflect the net tax effects of temporary differences between the bases of assets and
liabilities for financial reporting and income tax purposes. The Company’s deferred tax assets and liabilities
consisted of the following:
2014 2013
Deferred tax assets:
Compensation and benefits $ 224 $ 367
Self-insurance 24 20
Property, plant and equipment and capitalized lease assets 132 110
Loss on sale of discontinued operations 1,339 1,341
Net operating loss carryforwards 23 22
Other 80 104
Gross deferred tax assets 1,822 1,964
Valuation allowance (1,356) (1,358)
Total deferred tax assets 466 606
Deferred tax liabilities:
Property, plant and equipment and capitalized lease assets (147) (204)
Inventories (40) (28)
Intangible assets (25) (21)
Other (16) (19)
Total deferred tax liabilities (228) (272)
Net deferred tax asset $ 238 $ 334
Net deferred tax assets of $238 as of February 22, 2014 reflect long-term deferred tax assets of $287 recorded in
Deferred tax assets in the Consolidated Balance Sheets and current deferred tax liabilities of $49 recorded in
Other current liabilities. Net deferred tax assets of $334 as of February 23, 2013 reflect long-term deferred tax
assets of $345 recorded in Deferred tax assets in the Consolidated Balance Sheets and current deferred tax
liabilities of $11 recorded in Other current liabilities.
88