Albertsons 2014 Annual Report Download - page 93
Download and view the complete annual report
Please find page 93 of the 2014 Albertsons annual report below. You can navigate through the pages in the report by either clicking on the pages listed below, or by using the keyword search tool below to find specific information within the annual report.-
 1
1 -
2
-
3
-
4
-
5
-
6
-
7
-
8
-
9
-
10
-
11
-
12
-
13
-
14
-
15
-
16
-
17
-
18
-
19
-
20
-
21
-
22
-
23
-
24
-
25
-
26
-
27
-
28
-
29
-
30
-
31
-
32
-
33
-
34
-
35
-
36
-
37
-
38
-
39
-
40
-
41
-
42
-
43
-
44
-
45
-
46
-
47
-
48
-
49
-
50
-
51
-
52
-
53
-
54
-
55
-
56
-
57
-
58
-
59
-
60
-
61
-
62
-
63
-
64
-
65
-
66
-
67
-
68
-
69
-
70
-
71
-
72
-
73
-
74
-
75
-
76
-
77
-
78
-
79
-
80
-
81
-
82
-
 83
83 -
 84
84 -
 85
85 -
 86
86 -
 87
87 -
 88
88 -
 89
89 -
 90
90 -
 91
91 -
 92
92 -
 93
93 -
 94
94 -
 95
95 -
 96
96 -
 97
97 -
 98
98 -
 99
99 -
 100
100 -
 101
101 -
 102
102 -
 103
103 -
104
-
105
-
106
-
107
-
108
-
109
-
110
-
111
-
112
-
113
-
114
-
115
-
116
-
117
-
118
-
119
-
120
-
121
-
122
-
123
-
124
-
125
-
126
-
127
-
128
-
129
-
130
-
131
-
132
-
133
-
134
-
135
-
136
-
137
-
138
-
139
-
140
-
141
-
142
-
143
-
144
 |
 |

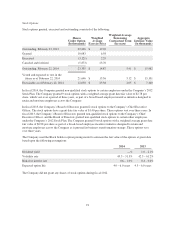
Stock Options
Stock options granted, exercised and outstanding consisted of the following:
Shares
Under Option
(In thousands)
Weighted
Average
Exercise Price
Weighted Average
Remaining
Contractual Term
(In years)
Aggregate
Intrinsic Value
(In thousands)
Outstanding, February 23, 2013 22,246 $ 19.20
Granted 10,083 6.58
Exercised (3,121) 2.29
Canceled and forfeited (5,873) 23.70
Outstanding, February 22, 2014 23,335 $ 14.87 5.41 $ 15,982
Vested and expected to vest in the
future as of February 22, 2014 21,646 $ 15.56 5.12 $ 15,101
Exercisable as of February 22, 2014 12,050 $ 23.38 2.05 $ 7,340
In fiscal 2014, the Company granted non-qualified stock options to certain employees under the Company’s 2012
Stock Plan. The Company granted 9 stock options with a weighted average grant date fair value of $2.78 per
share, which vest over a period of three years, as part of a broad-based employee incentive initiative designed to
retain and motivate employees across the Company.
In fiscal 2013, the Company’s Board of Directors granted 2 stock options to the Company’s Chief Executive
Officer. The stock options have a grant date fair value of $1.40 per share. These options vest over three years. In
fiscal 2013, the Company’s Board of Directors granted non-qualified stock options to the Company’s Chief
Executive Officer, and the Board of Directors granted non-qualified stock options to certain other employees,
under the Company’s 2012 Stock Plan. The Company granted 8 stock options with a weighted average grant date
fair value of $0.98 per share as part of a broad-based employee incentive initiative designed to retain and
motivate employees across the Company as it pursued its business transformation strategy. These options vest
over three years.
The Company used the Black Scholes option pricing model to estimate the fair value of the options at grant date
based upon the following assumptions:
2014 2013
Dividend yield —% 1.0 – 2.1%
Volatility rate 49.3 – 51.3% 42.3 – 61.2%
Risk-free interest rate 0.6 – 1.0% 0.4 – 0.6%
Expected option life 4.0 – 6.0 years 4.5 – 6.0 years
The Company did not grant any shares of stock options during fiscal 2012.
91