Albertsons 2014 Annual Report Download - page 40
Download and view the complete annual report
Please find page 40 of the 2014 Albertsons annual report below. You can navigate through the pages in the report by either clicking on the pages listed below, or by using the keyword search tool below to find specific information within the annual report.-
 1
1 -
2
-
3
-
4
-
5
-
6
-
7
-
8
-
9
-
10
-
11
-
12
-
13
-
14
-
15
-
16
-
17
-
18
-
19
-
20
-
21
-
22
-
23
-
24
-
25
-
26
-
27
-
28
-
29
-
 30
30 -
 31
31 -
 32
32 -
 33
33 -
 34
34 -
 35
35 -
 36
36 -
 37
37 -
 38
38 -
 39
39 -
 40
40 -
 41
41 -
 42
42 -
 43
43 -
 44
44 -
 45
45 -
 46
46 -
 47
47 -
 48
48 -
 49
49 -
 50
50 -
51
-
52
-
53
-
54
-
55
-
56
-
57
-
58
-
59
-
60
-
61
-
62
-
63
-
64
-
65
-
66
-
67
-
68
-
69
-
70
-
71
-
72
-
73
-
74
-
75
-
76
-
77
-
78
-
79
-
80
-
81
-
82
-
83
-
84
-
85
-
86
-
87
-
88
-
89
-
90
-
91
-
92
-
93
-
94
-
95
-
96
-
97
-
98
-
99
-
100
-
101
-
102
-
103
-
104
-
105
-
106
-
107
-
108
-
109
-
110
-
111
-
112
-
113
-
114
-
115
-
116
-
117
-
118
-
119
-
120
-
121
-
122
-
123
-
124
-
125
-
126
-
127
-
128
-
129
-
130
-
131
-
132
-
133
-
134
-
135
-
136
-
137
-
138
-
139
-
140
-
141
-
142
-
143
-
144
 |
 |
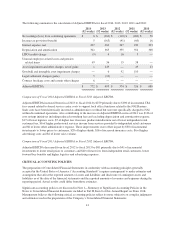
primarily of severance costs and a multi-employer pension withdrawal charge of $36 and store closure and exit
costs of $22, partially offset by a cash settlement received from credit card companies of $10. When adjusted for
these items, the remaining reduction in Selling and administrative expenses is primarily due to lower sales
volume.
Selling and administrative expenses for fiscal 2013 were 14.5 percent of Net sales compared to 13.1 percent of
Net sales for fiscal 2012. When adjusted for the above items, Selling and administrative expenses for fiscal 2013
were 12.9 percent of Net sales, compared to 13.1 percent of Net sales for fiscal 2012.
Goodwill and Intangible Asset Impairment Charges
The Company applies a fair value based impairment test to the net book value of goodwill and intangible assets
with indefinite useful lives on an annual basis and on an interim basis if certain events or circumstances indicate
that an impairment loss may have occurred.
During fiscal 2013, the Company performed reviews of goodwill and intangible assets with indefinite useful lives
for impairment, which indicated that the carrying value of Independent Business’s intangible assets with
indefinite useful lives exceeded their estimated fair values. In fiscal 2013, the Company recorded a non-cash
intangible asset impairment charge of $6 in the Independent Business segment. The Company recorded a non-
cash goodwill impairment charge of $92 for fiscal 2012.
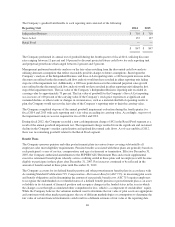
Operating (Loss) Earnings
The operating loss from continuing operations for fiscal 2013 was $157 compared with operating earnings of $96
for fiscal 2012. The operating loss from continuing operations for fiscal 2013 includes non-cash property, plant
and equipment impairment charges of $227, employee-related expenses, primarily severance costs and a multi-
employer pension withdrawal charge of $36, store closure costs of $22 and net lower goodwill and intangible
asset impairment charges of $86 from fiscal 2012, partially offset by a cash settlement received from credit card
companies of $10 before tax. In addition, excluding the above items operating earnings were primarily impacted
by unfavorable Gross profit in the Save-A-Lot and Independent Business segments.
Independent Business operating earnings for fiscal 2013 were $199, or 2.4 percent of Independent Business net
sales, compared with $254, or 3.1 percent of Independent Business net sales, for fiscal 2012. The $55 decrease in
Independent Business operating earnings includes $11 of non-cash property, plant and equipment and intangible
asset impairment charges and net $7 of higher severance costs. When adjusted for these items, the $37 decrease
is due primarily to gross margin investment and change in business mix partially offset by a lower LIFO charge
and lower employee related costs.
Save-A-Lot operating earnings for fiscal 2013 were $143, or 3.4 of Save-A-Lot net sales, compared with $230, or
5.4 percent of Save-A-Lot net sales, for fiscal 2012. The $87 decrease in Save-A-Lot operating earnings reflects
$22 of net charges related to the closure of 22 non-strategic stores and $13 of non-cash property, plant and
equipment impairment charges. After adjusting for these charges, the remaining decrease is primarily due to
negative gross profit impacts from competitive price investment, higher advertising and shrink costs.
Retail Food operating loss for fiscal 2013 was $160 or negative 3.4 percent of Retail Food net sales compared
with an operating loss of $36 or negative 0.7 percent of Retail Food net sales for fiscal 2012, an increase in the
operating loss of $124. For fiscal 2013, Retail Food operating loss from continuing operations includes non-cash
property, plant and equipment impairment charges of $203 and severance costs and multi-employer pension
withdrawal charge of $9, partially offset by a cash settlement received from credit card companies of $10. For
fiscal 2012 Retail Food operating loss includes a goodwill impairment charge of $92 and severance costs of $3.
When adjusted for these items, the remaining decrease in operating earnings for Retail Food in fiscal 2013 is
primarily due to the impact of lower sales volumes.
38