Albertsons 2014 Annual Report Download - page 76
Download and view the complete annual report
Please find page 76 of the 2014 Albertsons annual report below. You can navigate through the pages in the report by either clicking on the pages listed below, or by using the keyword search tool below to find specific information within the annual report.-
 1
1 -
2
-
3
-
4
-
5
-
6
-
7
-
8
-
9
-
10
-
11
-
12
-
13
-
14
-
15
-
16
-
17
-
18
-
19
-
20
-
21
-
22
-
23
-
24
-
25
-
26
-
27
-
28
-
29
-
30
-
31
-
32
-
33
-
34
-
35
-
36
-
37
-
38
-
39
-
40
-
41
-
42
-
43
-
44
-
45
-
46
-
47
-
48
-
49
-
50
-
51
-
52
-
53
-
54
-
55
-
56
-
57
-
58
-
59
-
60
-
61
-
62
-
63
-
64
-
65
-
 66
66 -
 67
67 -
 68
68 -
 69
69 -
 70
70 -
 71
71 -
 72
72 -
 73
73 -
 74
74 -
 75
75 -
 76
76 -
 77
77 -
 78
78 -
 79
79 -
 80
80 -
 81
81 -
 82
82 -
 83
83 -
 84
84 -
 85
85 -
 86
86 -
87
-
88
-
89
-
90
-
91
-
92
-
93
-
94
-
95
-
96
-
97
-
98
-
99
-
100
-
101
-
102
-
103
-
104
-
105
-
106
-
107
-
108
-
109
-
110
-
111
-
112
-
113
-
114
-
115
-
116
-
117
-
118
-
119
-
120
-
121
-
122
-
123
-
124
-
125
-
126
-
127
-
128
-
129
-
130
-
131
-
132
-
133
-
134
-
135
-
136
-
137
-
138
-
139
-
140
-
141
-
142
-
143
-
144
 |
 |
indicate that the asset might be impaired. The reviews consist of comparing estimated fair value to the carrying
value. Fair values of the Company’s trademarks and tradenames are determined primarily by discounting an
assumed royalty value applied to management’s estimate of projected future revenues associated with the tradename
using management’s expectations of the current and future operating environment. The royalty cash flows are
discounted using rates based on the weighted average cost of capital discussed above and the specific risk profile of
the tradenames relative to the Company’s other assets. These estimates are impacted by variable factors including
inflation, the general health of the economy and market competition. The calculation of the impairment charge
contains significant judgments and estimates including weighted average cost of capital and the specified risk
profile of the tradename and future revenue and profitability. Refer to Note 2—Goodwill and Intangible Assets in
the accompanying Notes to Consolidated Financial Statements for the results of the goodwill and intangible assets
with indefinite useful lives testing performed during fiscal 2014 and 2013.
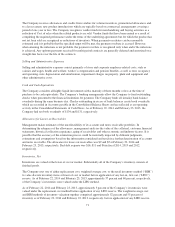
Impairment of Long-Lived Assets
The Company monitors the recoverability of its long-lived assets such as buildings and equipment, and evaluates
their carrying value for impairment whenever events or changes in circumstances indicate that the carrying
amount of such assets may not be fully recoverable. Events that may trigger such an evaluation include current
period losses combined with a history of losses or a projection of continuing losses, a significant decrease in the
market value of an asset or the Company’s plans for store closures. When such events or changes in
circumstances occur, a recoverability test is performed by comparing projected undiscounted future cash flows to
the carrying value of the group of assets being tested.
If impairment is identified for long-lived assets to be held and used, the fair value is compared to the carrying value
of the group of assets and an impairment charge is recorded for the excess of the carrying value over the fair value.
For long-lived assets that are classified as assets held for sale, the Company recognizes impairment charges for the
excess of the carrying value plus estimated costs of disposal over the estimated fair value. Fair value is based on
current market values or discounted future cash flows using Level 3 inputs. The Company estimates fair value based
on the Company’s experience and knowledge of the market in which the property is located and, when necessary,
utilizes local real estate brokers. The Company’s estimate of undiscounted cash flows attributable to the asset
groups included only future cash flows that are directly associated with and that are expected to arise as a direct
result of the use and eventual disposition of the asset group. Long-lived asset impairment charges are a component
of Selling and administrative expenses in the Consolidated Statements of Operations.
The Company groups long-lived assets with other assets at the lowest level for which identifiable cash flows are
largely independent of the cash flows of other assets, which historically has predominately been at the
geographic market level but individual store asset groupings have been assessed in certain circumstances.
Independent Business’s long-lived assets are reviewed for impairment at the distribution center level. Save-A-
Lot’s long-lived assets are reviewed for impairment at the geographic market level for 11 geographic market
groupings of individual corporate-owned stores and related dedicated distribution centers and individual
corporate store level for 29 individual corporate stores which were part of previous asset groups for which
management determined that the cash flows in those geographic market areas were no longer interdependent.
Retail Food’s long-lived assets are reviewed for impairment at the geographic market group level for five
geographic market groupings of individual retail stores.
During fiscal 2013, the Company determined it would be more appropriate to evaluate long-lived assets for
impairment at the store level for two geographic markets within the Save-A-Lot segment. These markets
continued to show higher indicators of economic decline that led to revised operating market strategies, such as
the identification of a significant number of stores for closure within one geographic market asset group and the
determined that Save-A-Lot was no longer expanding or maintaining another geographic market group. As such,
these geographic market groups were not generating joint cash flows from the operation of the asset group,
resulting in the disaggregation of the asset groups. These asset group disaggregations triggered a store-level
impairment review within these previous geographic market asset groups, which resulted in a non-cash
impairment charge of approximately $8 in fiscal 2013.
74