Albertsons 2014 Annual Report Download - page 38
Download and view the complete annual report
Please find page 38 of the 2014 Albertsons annual report below. You can navigate through the pages in the report by either clicking on the pages listed below, or by using the keyword search tool below to find specific information within the annual report.-
 1
1 -
2
-
3
-
4
-
5
-
6
-
7
-
8
-
9
-
10
-
11
-
12
-
13
-
14
-
15
-
16
-
17
-
18
-
19
-
20
-
21
-
22
-
23
-
24
-
25
-
26
-
27
-
 28
28 -
 29
29 -
 30
30 -
 31
31 -
 32
32 -
 33
33 -
 34
34 -
 35
35 -
 36
36 -
 37
37 -
 38
38 -
 39
39 -
 40
40 -
 41
41 -
 42
42 -
 43
43 -
 44
44 -
 45
45 -
 46
46 -
 47
47 -
 48
48 -
49
-
50
-
51
-
52
-
53
-
54
-
55
-
56
-
57
-
58
-
59
-
60
-
61
-
62
-
63
-
64
-
65
-
66
-
67
-
68
-
69
-
70
-
71
-
72
-
73
-
74
-
75
-
76
-
77
-
78
-
79
-
80
-
81
-
82
-
83
-
84
-
85
-
86
-
87
-
88
-
89
-
90
-
91
-
92
-
93
-
94
-
95
-
96
-
97
-
98
-
99
-
100
-
101
-
102
-
103
-
104
-
105
-
106
-
107
-
108
-
109
-
110
-
111
-
112
-
113
-
114
-
115
-
116
-
117
-
118
-
119
-
120
-
121
-
122
-
123
-
124
-
125
-
126
-
127
-
128
-
129
-
130
-
131
-
132
-
133
-
134
-
135
-
136
-
137
-
138
-
139
-
140
-
141
-
142
-
143
-
144
 |
 |
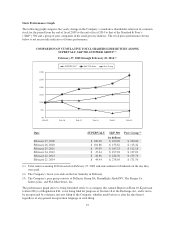
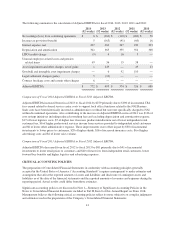
charge decrease and $6 after tax ($0.02 per diluted share) of net other administrative expense, offset in part
primarily by $18 after tax ($0.07 per diluted share) of incremental investments to lower prices to customers and
$17 after tax ($0.07 per diluted share) of higher shrink.
Income from Discontinued Operations, Net of Income Taxes
On January 10, 2013, the Company entered into a stock purchase agreement to sell NAI, which contained
components of Retail Food and Corporate functions. The Company completed the NAI Banner Sale on
March 21, 2013. As a result of the NAI Banner Sale, the financial results for those operations are presented as
discontinued operations for all periods presented.
Net sales of discontinued operations were $1,235 for fiscal 2014, compared with $17,230 for last year. The net
sales for fiscal 2014 reflect sales for the 4-week period from February 24, 2013, the start of fiscal 2014, to
March 21, 2013, the date of the completion of the NAI Banner Sale, whereas net sales for fiscal 2013 reflect such
sales for the 52 week period ended February 23, 2013.
Income from discontinued operations, net of tax, was $176 for fiscal 2014, compared with a net loss of $1,203
last year. Results for fiscal 2014 included a pre- tax reduction in the preliminarily estimated loss on the sale of
NAI of $90 and discrete tax benefits of $105 primarily resulting from the settlement of Internal Revenue Service
audits for the fiscal 2010, 2009 and 2008 tax years, which were offset in part by severance and other costs of $13.
Refer to Note 14—Discontinued Operations and Divestitures in the Notes to Consolidated Financial Statements
included in Part II, Item 8 of this Annual Report on Form 10-K for further discussion.
Comparison of fiscal 2013 ended February 23, 2013 and fiscal 2012 ended February 25, 2012:
Summary
Consolidated net sales for fiscal 2013 were $17,139, compared with $17,383 for fiscal 2012. Net loss from
continuing operations for fiscal 2013 was $263, or $1.24 per basic and diluted share, compared with net loss of
$110, or $0.52 per basic and diluted share for fiscal 2012.
Consolidated results for fiscal 2013 include net charges of $303 before tax ($187 after tax, or $0.88 per diluted
share), comprised of non-cash property, plant and equipment impairment charges of $227 before tax ($140 after
tax, or $0.66 per diluted share), employee-related expenses, primarily severance costs and a multi-employer
pension withdrawal charge of $36 before tax ($23 after tax, or $0.10 per diluted share), write-off of unamortized
financing costs of $22 before tax ($14 after tax, or $0.07 per diluted share), store closure costs of $22 before tax
($13 after tax, or $0.06 per diluted share) and intangible asset impairment charges of $6 before tax ($3 after tax,
or $0.02 per diluted share) which were partially offset by a cash settlement received from credit card companies
of $10 before tax ($6 after tax, or $0.03 per diluted share).
During fiscal 2013, the Company added 69 new stores through new store development, and closed 70 stores,
including planned dispositions, all of which were Save-A-Lot stores. Total retail square footage as of the end of
fiscal 2013 was approximately 17.4 million, a decrease of approximately 0.9 percent from the end of fiscal 2012.
Total retail square footage, excluding actual and planned store dispositions, increased 2.7 percent from the end of
fiscal 2012.
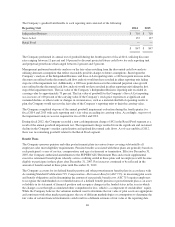
Net Sales
Net sales for fiscal 2013 were $17,139, compared with $17,383 for fiscal 2012, a decrease of $244 or 1.4 percent.
Independent Business net sales were 47.6 percent of Net sales for fiscal 2013, Save-A-Lot net sales were 24.5
percent of Net sales, Retail Food net sales were 27.7 percent of Net sales and Corporate fees earned under the
TSA were 0.2 percent of Net sales for fiscal 2013, compared with 47.1 percent, 24.3 percent, 28.3 percent and
0.3 percent, respectively, in fiscal 2012.
36