Albertsons 2014 Annual Report Download - page 65
Download and view the complete annual report
Please find page 65 of the 2014 Albertsons annual report below. You can navigate through the pages in the report by either clicking on the pages listed below, or by using the keyword search tool below to find specific information within the annual report.-
 1
1 -
2
-
3
-
4
-
5
-
6
-
7
-
8
-
9
-
10
-
11
-
12
-
13
-
14
-
15
-
16
-
17
-
18
-
19
-
20
-
21
-
22
-
23
-
24
-
25
-
26
-
27
-
28
-
29
-
30
-
31
-
32
-
33
-
34
-
35
-
36
-
37
-
38
-
39
-
40
-
41
-
42
-
43
-
44
-
45
-
46
-
47
-
48
-
49
-
50
-
51
-
52
-
53
-
54
-
 55
55 -
 56
56 -
 57
57 -
 58
58 -
 59
59 -
 60
60 -
 61
61 -
 62
62 -
 63
63 -
 64
64 -
 65
65 -
 66
66 -
 67
67 -
 68
68 -
 69
69 -
 70
70 -
 71
71 -
 72
72 -
 73
73 -
 74
74 -
 75
75 -
76
-
77
-
78
-
79
-
80
-
81
-
82
-
83
-
84
-
85
-
86
-
87
-
88
-
89
-
90
-
91
-
92
-
93
-
94
-
95
-
96
-
97
-
98
-
99
-
100
-
101
-
102
-
103
-
104
-
105
-
106
-
107
-
108
-
109
-
110
-
111
-
112
-
113
-
114
-
115
-
116
-
117
-
118
-
119
-
120
-
121
-
122
-
123
-
124
-
125
-
126
-
127
-
128
-
129
-
130
-
131
-
132
-
133
-
134
-
135
-
136
-
137
-
138
-
139
-
140
-
141
-
142
-
143
-
144
 |
 |

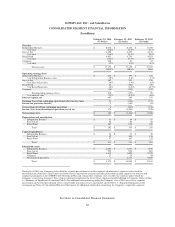
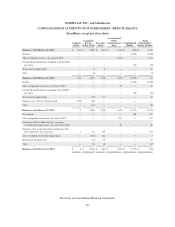
SUPERVALU INC. and Subsidiaries
CONSOLIDATED STATEMENTS OF OPERATIONS
(In millions, except per share data)
February 22, 2014
(52 weeks)
February 23, 2013
(52 weeks)
February 25, 2012
(52 weeks)
Net sales $ 17,155 $ 17,139 $ 17,383
Cost of sales 14,623 14,803 14,926
Gross profit 2,532 2,336 2,457
Selling and administrative expenses 2,114 2,487 2,269
Goodwill and intangible asset impairment charges —692
Operating earnings (loss) 418 (157) 96
Interest
Interest expense 407 272 251
Interest (income) — (3) (4)
Interest expense, net 407 269 247
Earnings (loss) from continuing operations before income taxes 11 (426) (151)
Income tax provision (benefit) 5 (163) (41)
Net earnings (loss) from continuing operations 6 (263) (110)
Income (loss) from discontinued operations, net of tax 176 (1,203) (930)
Net earnings (loss) $ 182 $ (1,466) $ (1,040)
Basic net earnings (loss) per common share:
Net earnings (loss) per share from continuing operations $ 0.02 $ (1.24) $ (0.52)
Net earnings (loss) per share from discontinued operations $ 0.69 $ (5.67) $ (4.39)
Net earnings (loss) per share $ 0.71 $ (6.91) $ (4.91)
Diluted net earnings (loss) per common share:
Net earnings (loss) per share from continuing operations $ 0.02 $ (1.24) $ (0.52)
Net earnings (loss) per share from discontinued operations $ 0.68 $ (5.67) $ (4.39)
Net earnings (loss) per share $ 0.70 $ (6.91) $ (4.91)
Weighted average number of shares outstanding:
Basic 255 212 212
Diluted 258 212 212
See Notes to Consolidated Financial Statements.
63