Xcel Energy 2004 Annual Report Download - page 87
Download and view the complete annual report
Please find page 87 of the 2004 Xcel Energy annual report below. You can navigate through the pages in the report by either clicking on the pages listed below, or by using the keyword search tool below to find specific information within the annual report.-
 1
1 -
2
-
3
-
4
-
5
-
6
-
7
-
8
-
9
-
10
-
11
-
12
-
13
-
14
-
15
-
16
-
17
-
18
-
19
-
20
-
21
-
22
-
23
-
24
-
25
-
26
-
27
-
28
-
29
-
30
-
31
-
32
-
33
-
34
-
35
-
36
-
37
-
38
-
39
-
40
-
41
-
42
-
43
-
44
-
45
-
46
-
47
-
48
-
49
-
50
-
51
-
52
-
53
-
54
-
55
-
56
-
57
-
58
-
59
-
60
-
61
-
62
-
63
-
64
-
65
-
66
-
67
-
68
-
69
-
70
-
71
-
72
-
73
-
74
-
75
-
76
-
 77
77 -
 78
78 -
 79
79 -
 80
80 -
 81
81 -
 82
82 -
 83
83 -
 84
84 -
 85
85 -
 86
86 -
 87
87 -
 88
88 -
 89
89 -
 90
90
 |
 |

NOTES to CONSOLIDATED FINANCIAL STATEMENTS
Xcel Energy Annual Report 2004
85
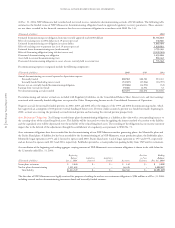
19. SEGMENTS AND RELATED INFORMATION
Xcel Energy has the following reportable segments: Regulated Electric Utility, Regulated Natural Gas Utility and All Other.
– Xcel Energy’s Regulated Electric Utility segment generates, transmits and distributes electricity in Minnesota, Wisconsin, Michigan, North Dakota,
South Dakota, Colorado, Texas, New Mexico, Kansas and Oklahoma. It also makes sales for resale and provides wholesale transmission service to
various entities in the United States. Regulated Electric Utility also includes commodity trading operations.
– Xcel Energy’s Regulated Natural Gas Utility segment transports, stores and distributes natural gas primarily in portions of Minnesota, Wisconsin,
North Dakota, Michigan and Colorado.
To report income from continuing operations for Regulated Electric and Regulated Natural Gas Utility segments, Xcel Energy must assign or allocate
all costs and certain other income. In general, costs are:
– directly assigned wherever applicable;
– allocated based on cost causation allocators wherever applicable; and
– allocated based on a general allocator for all other costs not assigned by the above two methods.
The accounting policies of the segments are the same as those described in Note 1 to the Consolidated Financial Statements. Xcel Energy evaluates
performance by each legal entity based on profit or loss generated from the product or service provided.
Regulated Regulated
Electric Natural Gas All Reconciling Consolidated
(Thousands of dollars) Utility Utility Other Eliminations Total
2004
Operating revenues from external customers $6,260,938 $1,923,526 $160,795 $ – $8,345,259
Intersegment revenues 1,132 8,735 38,920 (48,787) –
Total revenues $6,262,070 $1,932,261 $199,715 $ (48,787) $8,345,259
Depreciation and amortization $ 610,127 $ 82,012 $ 16,335 $ – $ 708,474
Financing costs, mainly interest expense 299,768 48,757 101,461 (14,829) 435,157
Income tax expense (benefit) 235,743 29,287 (105,444) – 159,586
Income (loss) from continuing operations $ 466,307 $ 86,092 $ 16,838 $ (42,308) $ 526,929
2003
Operating revenues from external customers $5,951,852 $1,685,346 $221,807 $ – $7,859,005
Intersegment revenues 1,123 10,868 53,866 (65,857) –
Total revenues $5,952,975 $1,696,214 $275,673 $ (65,857) $7,859,005
Depreciation and amortization $ 625,132 $ 80,688 $ 23,172 $ – $ 728,992
Financing costs, mainly interest expense 312,432 57,673 104,017 (22,911) 451,211
Income tax expense (benefit) 239,671 31,314 (99,584) – 171,401
Income (loss) from continuing operations $ 461,363 $ 94,056 $ 8,000 $ (37,579) $ 525,840
2002
Operating revenues from external customers $5,422,496 $1,340,698 $211,048 $ – $6,974,242
Intersegment revenues 987 5,396 94,304 (100,684) 3
Total revenues $5,423,483 $1,346,094 $305,352 $(100,684) $6,974,245
Depreciation and amortization $ 646,056 $ 86,142 $ 14,363 $ – $ 746,561
Financing costs, mainly interest expense 285,673 48,390 125,662 (38,605) 421,120
Income tax expense (benefit) 296,556 44,127 (94,837) – 245,846
Income (loss) from continuing operations $ 484,937 $ 88,237 $ 24,682 $ (46,468) $ 551,388