Xcel Energy 2004 Annual Report Download - page 45
Download and view the complete annual report
Please find page 45 of the 2004 Xcel Energy annual report below. You can navigate through the pages in the report by either clicking on the pages listed below, or by using the keyword search tool below to find specific information within the annual report.-
 1
1 -
2
-
3
-
4
-
5
-
6
-
7
-
8
-
9
-
10
-
11
-
12
-
13
-
14
-
15
-
16
-
17
-
18
-
19
-
20
-
21
-
22
-
23
-
24
-
25
-
26
-
27
-
28
-
29
-
30
-
31
-
32
-
33
-
34
-
 35
35 -
 36
36 -
 37
37 -
 38
38 -
 39
39 -
 40
40 -
 41
41 -
 42
42 -
 43
43 -
 44
44 -
 45
45 -
 46
46 -
 47
47 -
 48
48 -
 49
49 -
 50
50 -
 51
51 -
 52
52 -
 53
53 -
 54
54 -
 55
55 -
56
-
57
-
58
-
59
-
60
-
61
-
62
-
63
-
64
-
65
-
66
-
67
-
68
-
69
-
70
-
71
-
72
-
73
-
74
-
75
-
76
-
77
-
78
-
79
-
80
-
81
-
82
-
83
-
84
-
85
-
86
-
87
-
88
-
89
-
90
 |
 |

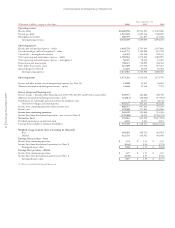
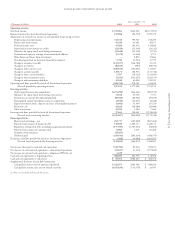
CONSOLIDATED STATEMENTS of CASH FLOWS
Xcel Energy Annual Report 2004
43
Year ended Dec. 31
(Thousands of dollars) 2004 2003 2002
Operating activities
Net (loss) income $ 355,961 $622,392 $(2,217,991)
Remove (income) loss from discontinued operations 170,968 (96,552) 2,769,379
Adjustments to reconcile net income to cash provided by operating activities:
Depreciation and amortization 741,544 759,523 768,250
Nuclear fuel amortization 43,296 43,401 48,675
Deferred income taxes 45,488 101,672 143,880
Amortization of investment tax credits (12,189) (12,439) (13,212)
Allowance for equity funds used during construction (33,648) (25,338) (7,793)
Undistributed equity in earnings of unconsolidated affiliates (5,379) (5,628) 5,774
Write-downs and losses from investments –8,856 15,866
Unrealized gain (loss) on derivative financial instruments 5,794 (1,954) 17,779
Change in accounts receivable (123,257) (126,786) 21,214
Change in inventories (46,185) (994) (30,555)
Change in other current assets (188,935) (167,051) 111,947
Change in accounts payable 129,171 106,576 (131,716)
Change in other current liabilities 5,707 (10,524) (133,693)
Change in other noncurrent assets (5,391) (133,025) (224,153)
Change in other noncurrent liabilities 42,948 45,096 138,521
Operating cash flows provided by (used in) discontinued operations (308,788) 270,761 432,939
Net cash provided by operating activities 817,105 1,377,986 1,715,111
Investing activities
Utility capital/construction expenditures (1,274,290) (944,421) (903,974)
Allowance for equity funds used during construction 33,648 25,338 7,793
Investments in external decommissioning fund (80,582) (80,581) (57,830)
Nonregulated capital expenditures and asset acquisitions (2,160) (12,611) (3,488)
Equity investments, loans, deposits and sales of nonregulated projects (4,082) 13,300 (17,253)
Restricted cash 42,628 (38,488) (23,000)
Other investments 12,588 1,106 7,040
Investing cash flows provided by (used in) discontinued operations 37,043 110,261 (1,720,614)
Net cash used in investing activities (1,235,207) (926,096) (2,711,326)
Financing activities
Short-term borrowings – net 253,737 (445,080) (867,466)
Proceeds from issuance of long-term debt 138,848 1,689,317 1,442,172
Repayment of long-term debt, including reacquisition premiums (157,595) (1,307,012) (32,802)
Proceeds from issuance of common stock 6,985 3,219 69,488
Common stock repurchase (32,023) ––
Dividends paid (320,444) (303,316) (496,375)
Financing cash flows provided by (used in) discontinued operations (200) (4,000) 1,465,070
Net cash (used in) provided by financing activities (110,692) (366,872) 1,580,087
Net increase (decrease) in cash and cash equivalents (528,794) 85,018 583,872
Net decrease in cash and cash equivalents – discontinued operations (13,167) (1,313) (237,882)
Net increase in cash and cash equivalents – adoption of FIN No. 46 3,439 ––
Cash and cash equivalents at beginning of year 568,283 484,578 138,588
Cash and cash equivalents at end of year $ 29,761 $568,283 $ 484,578
Supplemental disclosure of cash flow information
Cash paid for interest (net of amounts capitalized) $ 423,673 $402,506 $ 640,628
Cash paid for income taxes (net of refunds received) $(355,639) $ (6,379) $ 24,935
See Notes to Consolidated Financial Statements.