Xcel Energy 2004 Annual Report Download - page 86
Download and view the complete annual report
Please find page 86 of the 2004 Xcel Energy annual report below. You can navigate through the pages in the report by either clicking on the pages listed below, or by using the keyword search tool below to find specific information within the annual report.-
 1
1 -
2
-
3
-
4
-
5
-
6
-
7
-
8
-
9
-
10
-
11
-
12
-
13
-
14
-
15
-
16
-
17
-
18
-
19
-
20
-
21
-
22
-
23
-
24
-
25
-
26
-
27
-
28
-
29
-
30
-
31
-
32
-
33
-
34
-
35
-
36
-
37
-
38
-
39
-
40
-
41
-
42
-
43
-
44
-
45
-
46
-
47
-
48
-
49
-
50
-
51
-
52
-
53
-
54
-
55
-
56
-
57
-
58
-
59
-
60
-
61
-
62
-
63
-
64
-
65
-
66
-
67
-
68
-
69
-
70
-
71
-
72
-
73
-
74
-
75
-
 76
76 -
 77
77 -
 78
78 -
 79
79 -
 80
80 -
 81
81 -
 82
82 -
 83
83 -
 84
84 -
 85
85 -
 86
86 -
 87
87 -
 88
88 -
 89
89 -
 90
90
 |
 |

NOTES to CONSOLIDATED FINANCIAL STATEMENTS
Xcel Energy Annual Report 2004
84
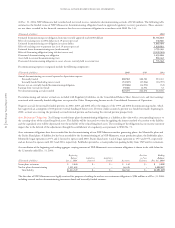
18. REGULATORY ASSETS AND LIABILITIES
Xcel Energy’s regulated businesses prepare their Consolidated Financial Statements in accordance with the provisions of SFAS No. 71, as discussed in
Note 1 to the Consolidated Financial Statements. Under SFAS No. 71, regulatory assets and liabilities can be created for amounts that regulators may
allow to be collected, or may require to be paid back to customers in future electric and natural gas rates. Any portion of Xcel Energy’s business that is
not regulated cannot use SFAS No. 71 accounting. The components of unamortized regulatory assets and liabilities of continuing operations shown
on the balance sheet at Dec. 31 were:
Remaining
(Thousands of dollars) See Note(s) Amortization Period 2004 2003
Regulatory Assets
Net nuclear asset retirement obligations 1, 17 End of licensed life $ 221,864 $ 186,989
Power purchase contract valuation adjustments 14 Term of related contract 102,741 154,260
AFDC recorded in plant (a) Plant lives 169,352 153,411
Losses on reacquired debt 1 Term of related debt 89,694 101,176
Conservation programs (a) Various 88,253 76,087
Nuclear decommissioning costs (b) Up to three years 20,494 37,654
Employees’ postretirement benefits other than pension 12 Three years 31,125 35,015
Renewable resource costs To be determined 38,985 25,972
Environmental costs 16, 17 Various 28,176 29,195
State commission accounting adjustments (a) Various 15,945 17,301
Plant asset recovery (Pawnee II and Metro Ash) Two-and-a-half years 12,258 17,162
Unrecovered natural gas costs (c) 1 One to two years 14,553 16,008
Unrecovered electric production costs (d) 1 Three months –13,779
Other Various 17,196 15,311
Total regulatory assets $ 850,636 $ 879,320
Regulatory Liabilities
Plant removal costs 1, 17 $ 891,018 $ 852,272
Pension costs – regulatory differences 12 377,893 338,926
Power purchase contract valuation adjustments 14 56,874 126,884
Unrealized gains from decommissioning investments 17 129,028 105,518
Investment tax credit deferrals 92,227 100,574
Deferred income tax adjustments 1 69,780 25,906
Interest on income tax refunds 9,667 7,233
Fuel costs, refunds and other 4,058 2,466
Total regulatory liabilities $1,630,545 $1,559,779
(a) Earns a return on investment in the ratemaking process. These amounts are amortized consistent with recovery in rates.
(b) These costs do not relate to NSP-Minnesota’s nuclear plants. They relate to DOE assessments, as discussed previously in Note 17, and unamortized costs for PSCo’s Fort St. Vrain
nuclear plant decommissioning.
(c) Excludes current portion expected to be returned to customers within 12 months of $12.4 million for 2004, and the 2003 current portion expected to be recovered from customers
of $3.1 million.
(d) Excludes current portion expected to be recovered within the next 12 months of $16.1 and $55.8 million for 2004 and 2003, respectively.