Xcel Energy 2004 Annual Report Download - page 25
Download and view the complete annual report
Please find page 25 of the 2004 Xcel Energy annual report below. You can navigate through the pages in the report by either clicking on the pages listed below, or by using the keyword search tool below to find specific information within the annual report.-
 1
1 -
2
-
3
-
4
-
5
-
6
-
7
-
8
-
9
-
10
-
11
-
12
-
13
-
14
-
 15
15 -
 16
16 -
 17
17 -
 18
18 -
 19
19 -
 20
20 -
 21
21 -
 22
22 -
 23
23 -
 24
24 -
 25
25 -
 26
26 -
 27
27 -
 28
28 -
 29
29 -
 30
30 -
 31
31 -
 32
32 -
 33
33 -
 34
34 -
 35
35 -
36
-
37
-
38
-
39
-
40
-
41
-
42
-
43
-
44
-
45
-
46
-
47
-
48
-
49
-
50
-
51
-
52
-
53
-
54
-
55
-
56
-
57
-
58
-
59
-
60
-
61
-
62
-
63
-
64
-
65
-
66
-
67
-
68
-
69
-
70
-
71
-
72
-
73
-
74
-
75
-
76
-
77
-
78
-
79
-
80
-
81
-
82
-
83
-
84
-
85
-
86
-
87
-
88
-
89
-
90
 |
 |

MANAGEMENT’S DISCUSSION and ANALYSIS
Xcel Energy Annual Report 2004
23
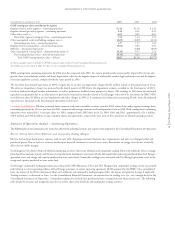
costs, as discussed later, but were largely related to regulated utility costs. Regulated utility earnings from continuing operations were reduced by
approximately 2 cents per share in 2002 due to a $5 million regulatory recovery adjustment for SPS and $9 million in employee separation costs
associated with a restaffing initiative for utility and service company operations. See Note 2 to the Consolidated Financial Statements for further
discussion of these items.
Interest and Other Income, Net of Nonoperating Expenses Interest and other income, net of nonoperating expenses increased $5 million in 2004
compared with 2003. The increase is due to interest income related to the finalization of prior-period Internal Revenue Service (IRS) audits of
$10.5 million. Partially offsetting the increase was the impact of a Utility Engineering gain on the sale of water rights in 2003, net of write-offs of
certain intangible assets.
Interest and other income, net of nonoperating expenses decreased $27 million in 2003 compared with 2002. Interest income decreased $13 million
primarily due to interest received on tax refunds in 2002. Other income decreased $10 million primarily due to a gain on the sale of contracts at Planergy
in 2002.
Interest and Financing Costs Interest charges and financing costs decreased approximately $16 million, or 3.6 percent, for 2004, compared with 2003.
The decrease for the year reflects savings from refinancing higher coupon debt during 2003 and lower credit line fees, partially offset by interest expense
related to prior-period IRS audits.
Interest and financing costs increased approximately $30 million, or 7.1 percent, for 2003 compared with 2002. This increase was due to the full-year
impact of the issuance of long-term debt in the latter part of 2002 intended to reduce dependence on short-term debt. In addition, during 2002, Xcel
Energy incurred approximately $15 million to redeem temporary holding company debt. During 2003, Xcel Energy issued approximately $1.7 billion
of long-term debt to refinance higher coupon debt. During 2002, certain long-term debt was refinanced at higher interest rates.
Income Tax Expense The effective tax rate was 23.2 percent for the year 2004, compared with 24.6 percent for the same period in 2003. Significant
tax benefits were recorded during the fourth quarters of 2004 and 2003 due to the resolution of tax audit issues, largely related to prior periods.
Significant income tax audit activity occurring in 2003 continued in 2004. With the exception of the corporate-owned life insurance (COLI) loan interest
deductibility, as discussed in Note 16, during 2004, Xcel Energy concluded IRS income tax audit and appeal activities spanning several examination
cycles dating back to 1993. In addition, the IRS nearly completed the examination cycle ended 2001 and began its review of Xcel Energy’s 2002 and
2003 tax years.
In 2004, income tax benefits of $39.3 million were recorded, including $28.9 million related to the successful resolution of various IRS audit issues and other
adjustments to current and deferred taxes related to prior years, $7.7 million for the 2003 return-to-actual true-up and $2.7 million from revisions to
benefits related to asset and foreign power sales. Excluding the tax benefits, the effective rate for 2004 would have been 28.9 percent.
In 2003, income tax benefits of $36 million were recorded to reflect the resolution of tax audit issues related to prior years. The tax issues resolved
during 2003 included the tax deductibility of certain merger costs associated with the mergers to form Xcel Energy and New Century Energies, Inc.
(NCE) and the deductibility, for state purposes, of certain tax benefit transfer lease benefits. Excluding these tax benefits, the effective rate for 2003
would have been 29.7 percent. See Note 10 to the Consolidated Financial Statements.
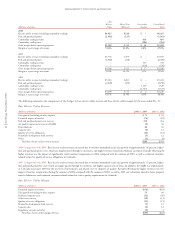
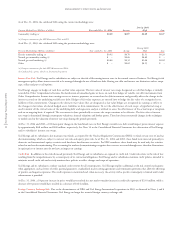
Other Nonregulated Subsidiaries and Holding Company Results
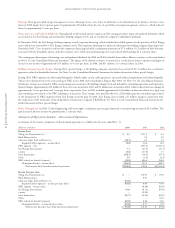
The following tables summarize the net income and earnings-per-share contributions of the continuing operations of Xcel Energy’s nonregulated businesses
and holding company results:
Contribution to Xcel Energy’s earnings (Millions of dollars) 2004 2003 2002
Eloigne Company $ 8.5 $ 7.7 $ 8.0
Planergy (1.3) (7.7) (1.7)
Financing costs – holding company (44.7) (44.1) (47.3)
Special charges – holding company (10.3) (11.2) (2.9)
Other nonregulated and holding company results 16.3 19.3 2.1
Total nonregulated/holding company loss – continuing operations $(31.5) $(36.0) $(41.8)
Contribution to Xcel Energy’s earnings per share 2004 2003 2002
Eloigne Company $ 0.02 $ 0.02 $ 0.02
Planergy –(0.02) –
Financing costs and preferred dividends – holding company (0.08) (0.09) (0.13)
Special charges – holding company (0.03) (0.03) (0.01)
Other nonregulated and holding company results 0.04 0.05 0.01
Total nonregulated/holding company loss per share – continuing operations $(0.05) $(0.07) $(0.11)
Eloigne Company Eloigne invests in affordable housing that qualifies for federal and state tax credits. Eloigne’s earnings contribution is expected to
decline slightly each year as tax credits on mature affordable housing projects begin to decline.