Xcel Energy 2004 Annual Report Download - page 21
Download and view the complete annual report
Please find page 21 of the 2004 Xcel Energy annual report below. You can navigate through the pages in the report by either clicking on the pages listed below, or by using the keyword search tool below to find specific information within the annual report.-
 1
1 -
2
-
3
-
4
-
5
-
6
-
7
-
8
-
9
-
10
-
 11
11 -
 12
12 -
 13
13 -
 14
14 -
 15
15 -
 16
16 -
 17
17 -
 18
18 -
 19
19 -
 20
20 -
 21
21 -
 22
22 -
 23
23 -
 24
24 -
 25
25 -
 26
26 -
 27
27 -
 28
28 -
 29
29 -
 30
30 -
 31
31 -
32
-
33
-
34
-
35
-
36
-
37
-
38
-
39
-
40
-
41
-
42
-
43
-
44
-
45
-
46
-
47
-
48
-
49
-
50
-
51
-
52
-
53
-
54
-
55
-
56
-
57
-
58
-
59
-
60
-
61
-
62
-
63
-
64
-
65
-
66
-
67
-
68
-
69
-
70
-
71
-
72
-
73
-
74
-
75
-
76
-
77
-
78
-
79
-
80
-
81
-
82
-
83
-
84
-
85
-
86
-
87
-
88
-
89
-
90
 |
 |

MANAGEMENT’S DISCUSSION and ANALYSIS
Xcel Energy Annual Report 2004
19
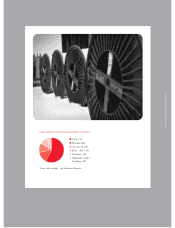
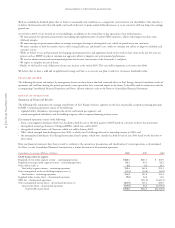
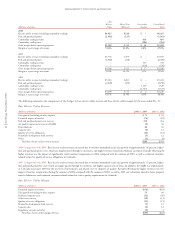
Contribution to earnings per share 2004 2003 2002
GAAP earnings per share contribution by segment
Regulated electric utility segment – continuing operations $1.10 $1.10 $ 1.26
Regulated natural gas utility segment – continuing operations 0.20 0.22 0.23
Other utility results (a) 0.02 0.02 0.05
Total utility segment earnings per share – continuing operations 1.32 1.34 1.54
Other nonregulated results and holding company costs (a) (0.05) (0.07) (0.11)
Total earnings per share – continuing operations 1.27 1.27 1.43
Regulated utility earnings (loss) – discontinued operations (0.02) 0.06 0.03
NRG loss – discontinued operations –(0.60) (8.95)
Other nonregulated earnings (loss) – discontinued operations (b) (0.38) 0.77 1.72
Total earnings (loss) per share – discontinued operations (0.40) 0.23 (7.20)
Total GAAP earnings (loss) per share – diluted $0.87 $1.50 $(5.77)
(a) Not a reportable segment. Included in All Other segment results in Note 19 to the Consolidated Financial Statements.
(b) Includes tax benefit related to NRG. See Note 3 to the Consolidated Financial Statements.
While earnings from continuing operations for 2004 were flat compared with 2003, the current period results were favorably impacted by electric sales
growth, short-term wholesale markets and lower depreciation, offset by the negative impact of unfavorable weather, legal settlement costs and the impacts
of certain regulatory accruals, compared with the same period in 2003.
The loss from discontinued operations in 2004 is largely due to an after-tax impairment charge of $143 million related to the planned sale of Seren.
The after-tax impairment charge was increased in the fourth quarter of 2004 from the impairment estimate recorded in the third quarter of 2004
based on further developed market information, as well as preliminary feedback from prospective buyers. The earnings in 2003 from discontinued
operations are primarily due to an adjustment to previously estimated tax benefits related to Xcel Energy’s write-off of its investment in NRG. NRG
recorded more than $3 billion of asset impairment and other charges in 2002 as it commenced its financial restructuring. Results from discontinued
operations are discussed in the Discontinued Operations section later.
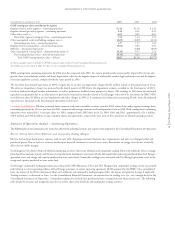
Common Stock Dilution Dilution, primarily from common stock and convertible securities issued in 2002, reduced the utility segment earnings from
continuing operations by 12 cents per share for 2003, compared with average common stock and equivalent levels in 2002. Total earnings from continuing
operations were reduced by 11 cents per share for 2003, compared with 2002 share levels. In 2004, 2003 and 2002, approximately 423.3 million,
418.9 million and 384.6 million average common shares and equivalents, respectively, were used in the calculation of diluted earnings per share.
Statement of Operations Analysis – Continuing Operations
The following discussion summarizes the items that affected the individual revenue and expense items reported in the Consolidated Statements of Operations.
Electric Utility, Short-Term Wholesale and Commodity Trading Margins
Electric fuel and purchased power expenses tend to vary with changing retail and wholesale sales requirements and unit cost changes in fuel and
purchased power. Due to fuel cost recovery mechanisms for retail customers in several states, most fluctuations in energy costs do not materially
affect electric utility margin.
Xcel Energy has two distinct forms of wholesale marketing activities: short-term wholesale and commodity trading. Short-term wholesale refers to energy-
related purchase and sales activity and the use of certain financial instruments associated with the fuel required for and energy produced from Xcel Energy’s
generation assets and energy and capacity purchased to serve native load. Commodity trading is not associated with Xcel Energy’s generation assets or the
energy and capacity purchased to serve native load.
Xcel Energy’s commodity trading operations are conducted by NSP-Minnesota, PSCo and SPS. Margins from commodity trading activity are partially
redistributed to other operating utilities of Xcel Energy, pursuant to a joint operating agreement (JOA) approved by the FERC. On a consolidated
basis, the impact of the JOA is eliminated. Short-term wholesale and commodity trading margins reflect the impact of regulatory sharing, if applicable.
Trading revenues, as discussed in Note 1 to the Consolidated Financial Statements, are reported net of trading costs (i.e., on a margin basis) in the
Consolidated Statements of Operations. Commodity trading costs include fuel, purchased power, transmission and other related costs. The following
table details the revenue and margin for base electric utility, short-term wholesale and commodity trading activities: